Figures from Global Carbon Project 2023
These are some of the figures that appear in the Global Carbon Project's 2023 release. For additional details, and explanations of all figures, please view the full presentation available here. For alternative visualisations of our data, see the Global Carbon Atlas and Our World in Data.
Our intention is that these figures and data are used. That's why they're released under the Creative Commons Attribution 4.0 International license. Simply put, you may freely copy and modify these figures and data, and use them in both commercial and non-commercial works, as long as you give credit to the Global Carbon Project.
If you're just tweeting a figure or using a figure in a presentation, then it already says at the bottom that it's by the Global Carbon Project, so you're good to go! If you use the data or modify the figure then you will need to make a little more effort.
For details on the license, visit the Creative Commons website. Suggested citation for use in a book: "Used with permission of the Global Carbon Project under the Creative Commons Attribution 4.0 International license."
Figures
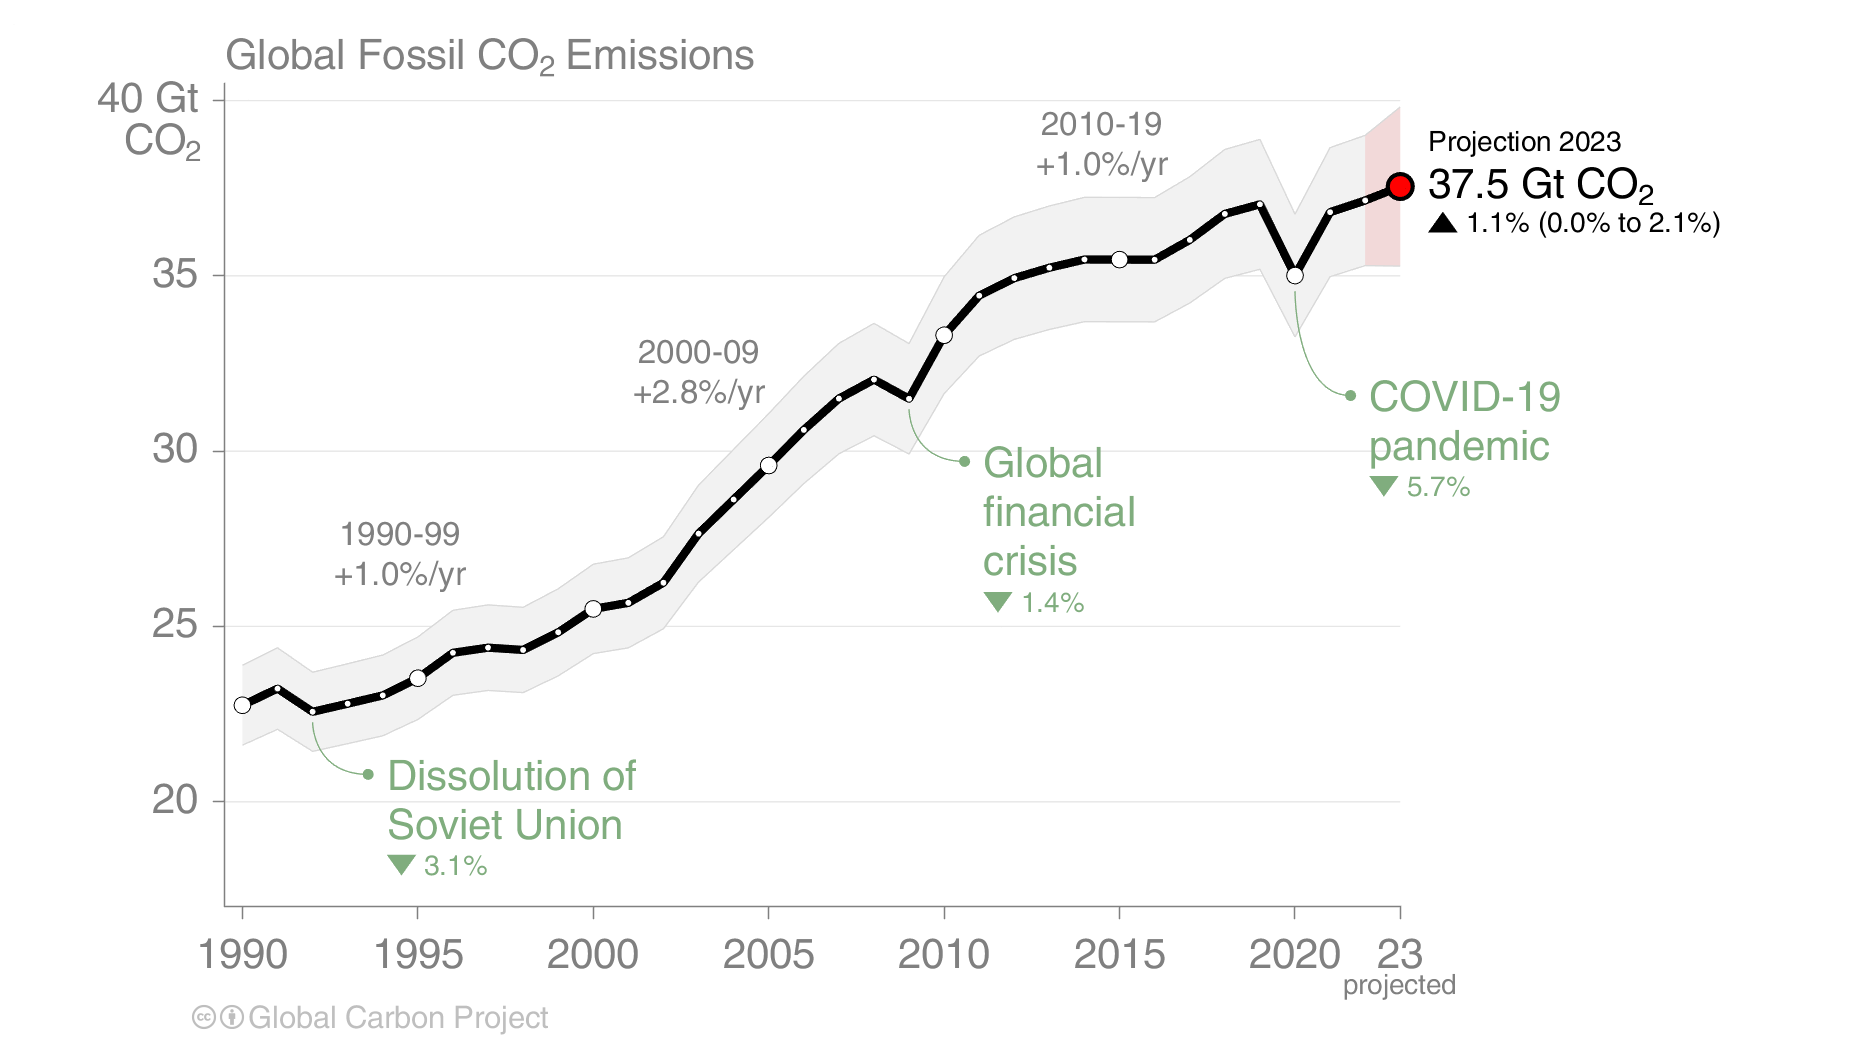
Global Fossil co₂ Emissions

Right click to download: CSV / PNG
Annual global energy consumption per capita

Right click to download: CSV / PNG
Atmospheric co₂ concentration

Right click to download: CSV / PNG
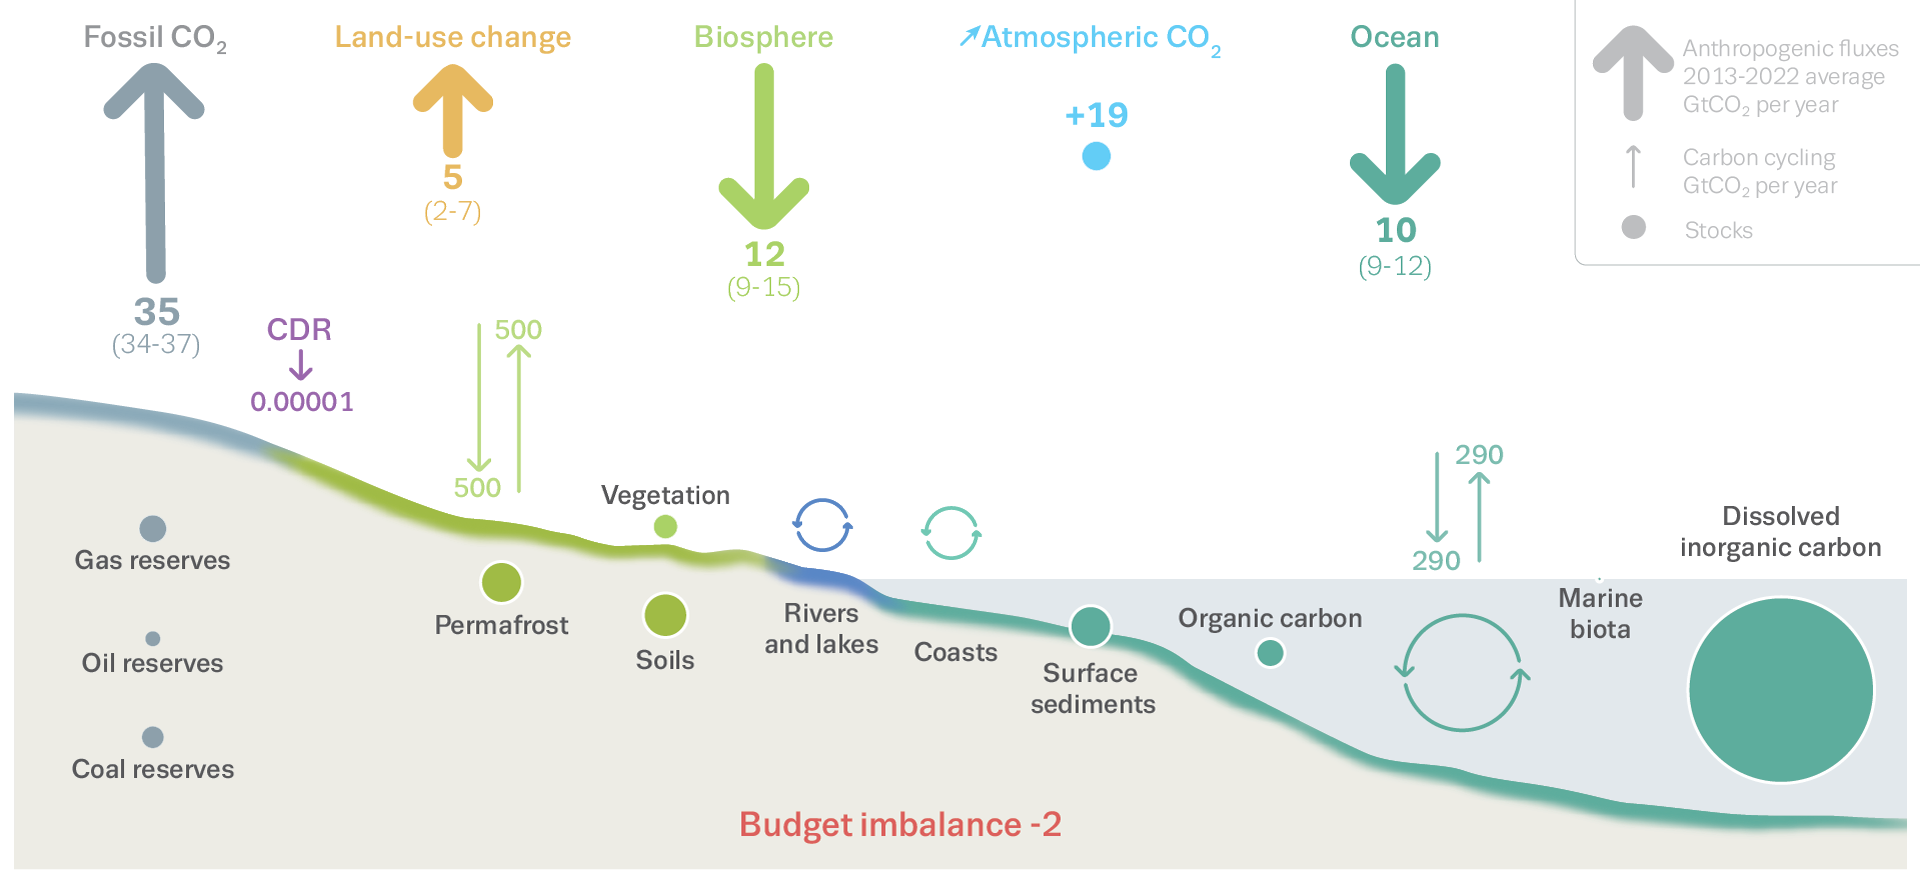
Perturbation of the carbon cycle

Right click to download: PNG
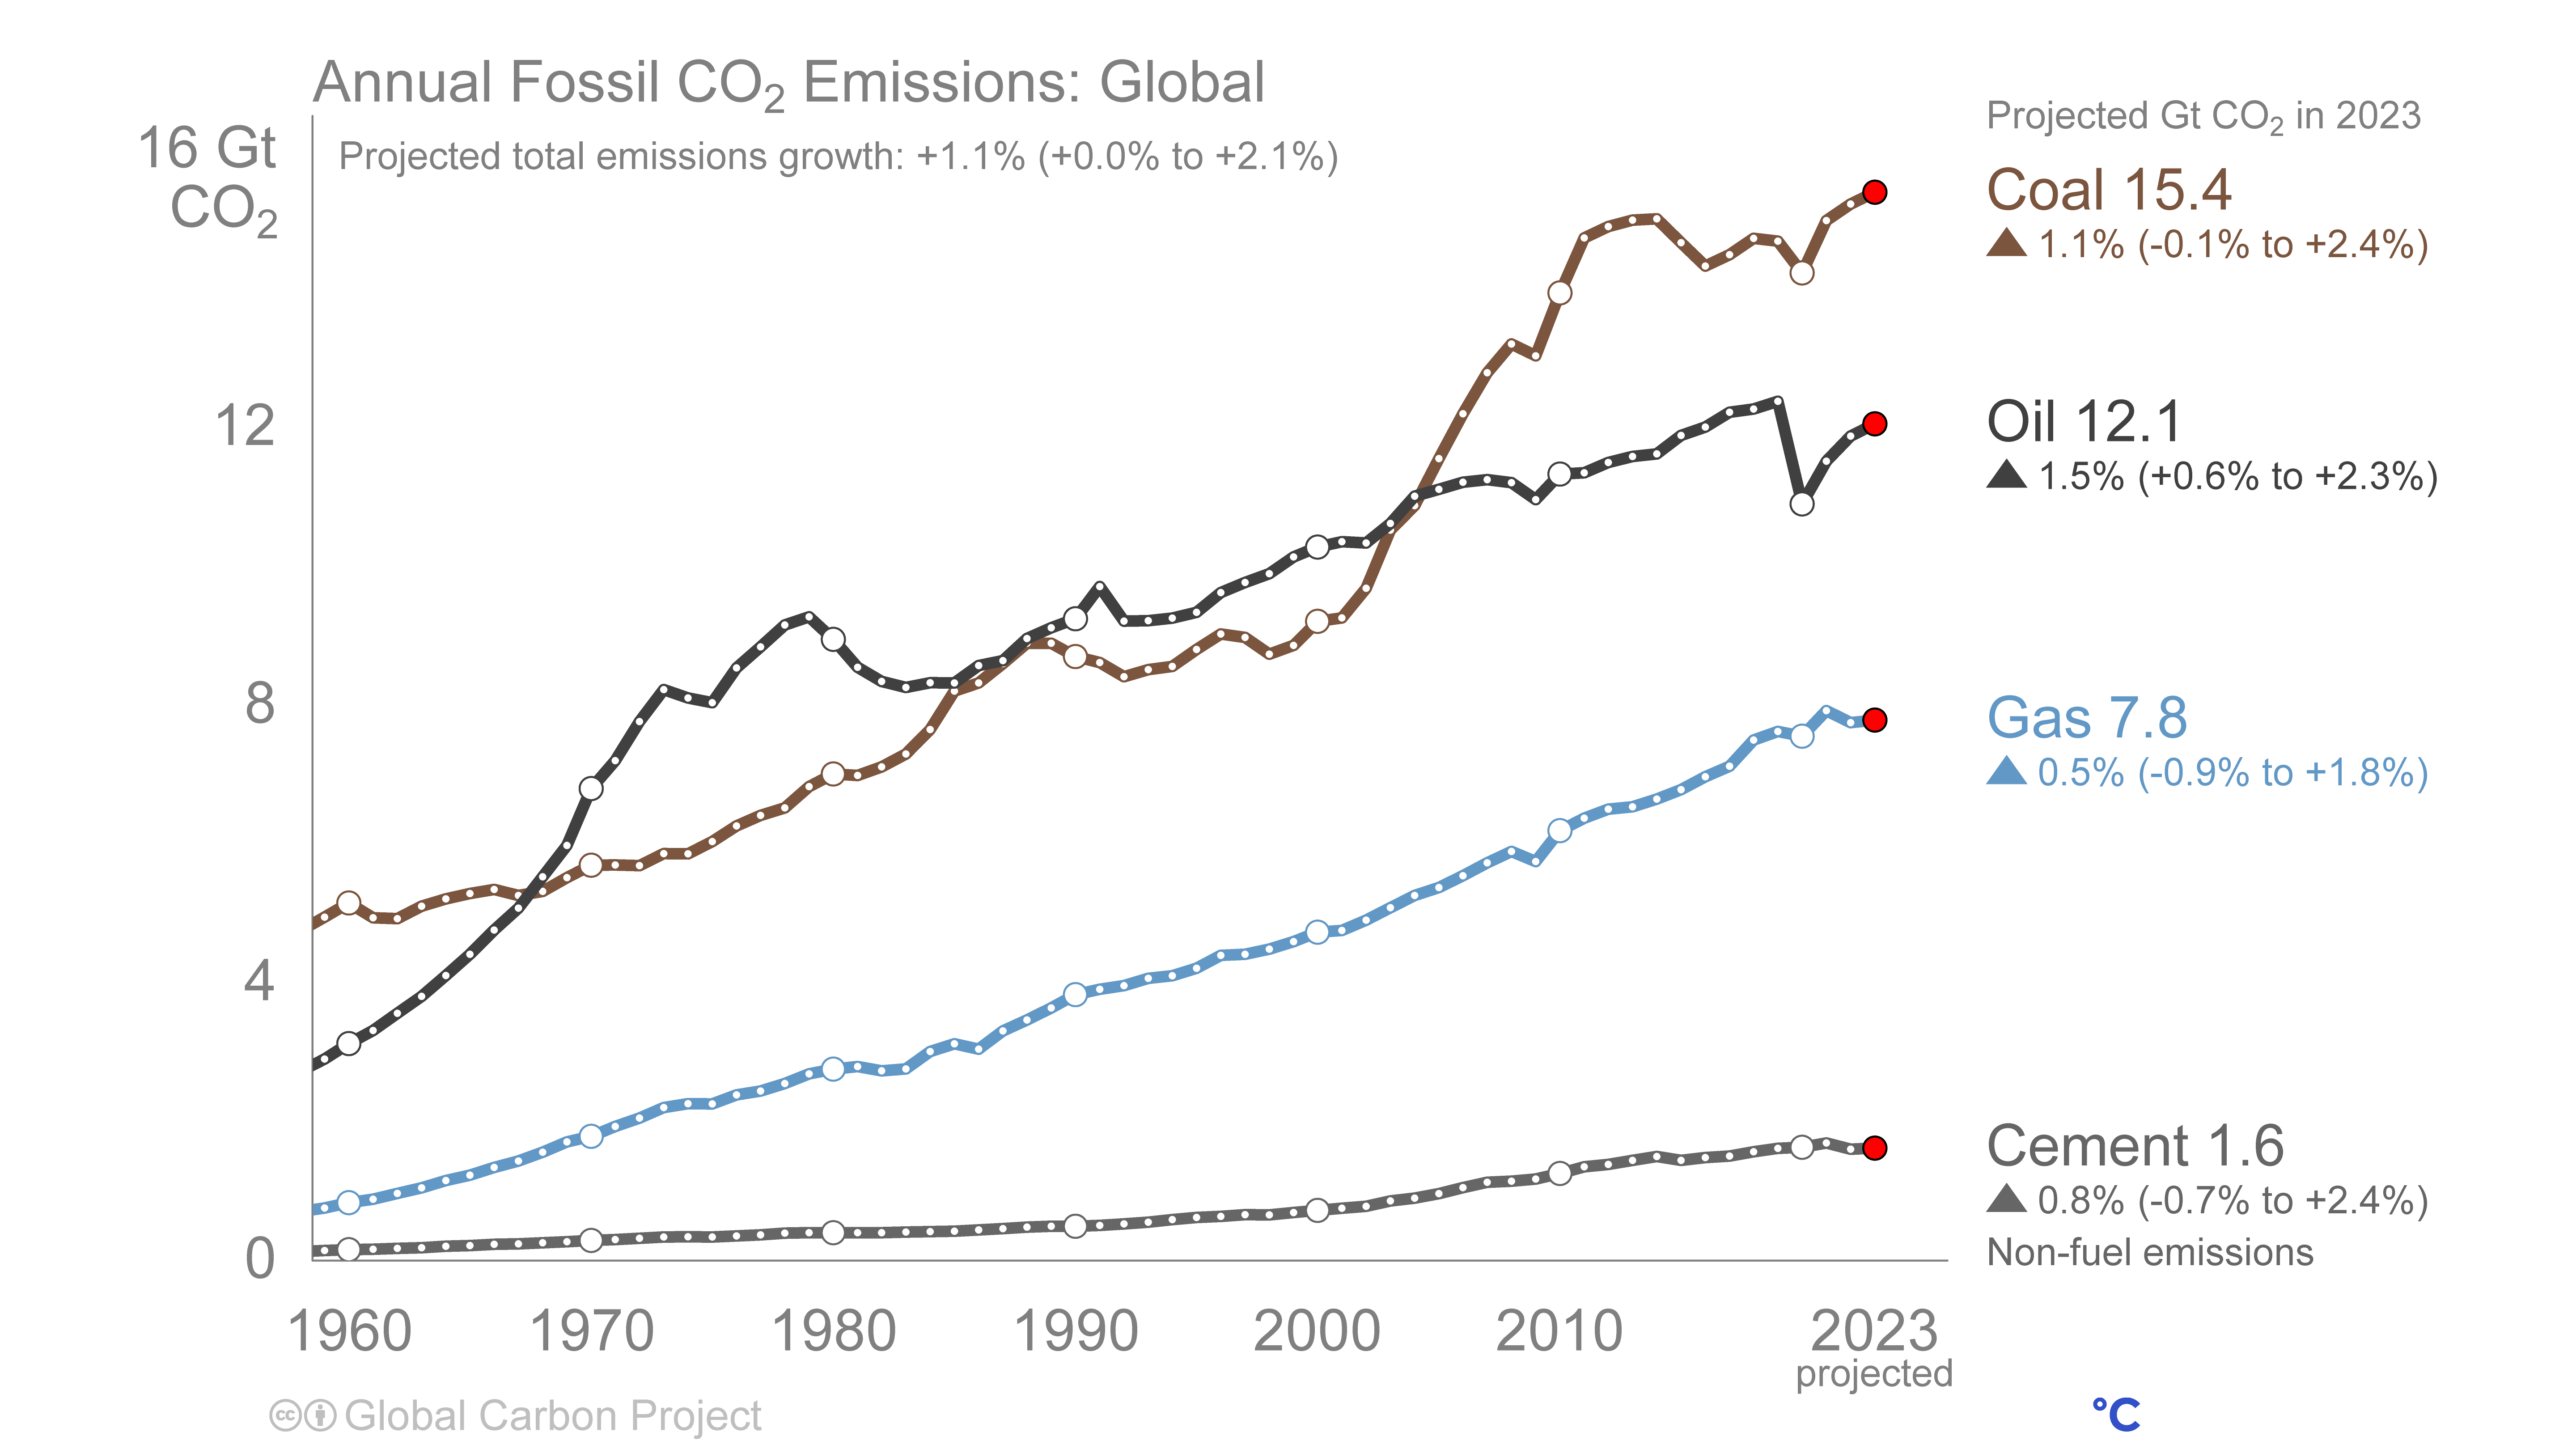
Annual Fossil co₂ Emissions and 2023 Projections

Right click to download: CSV / PNG
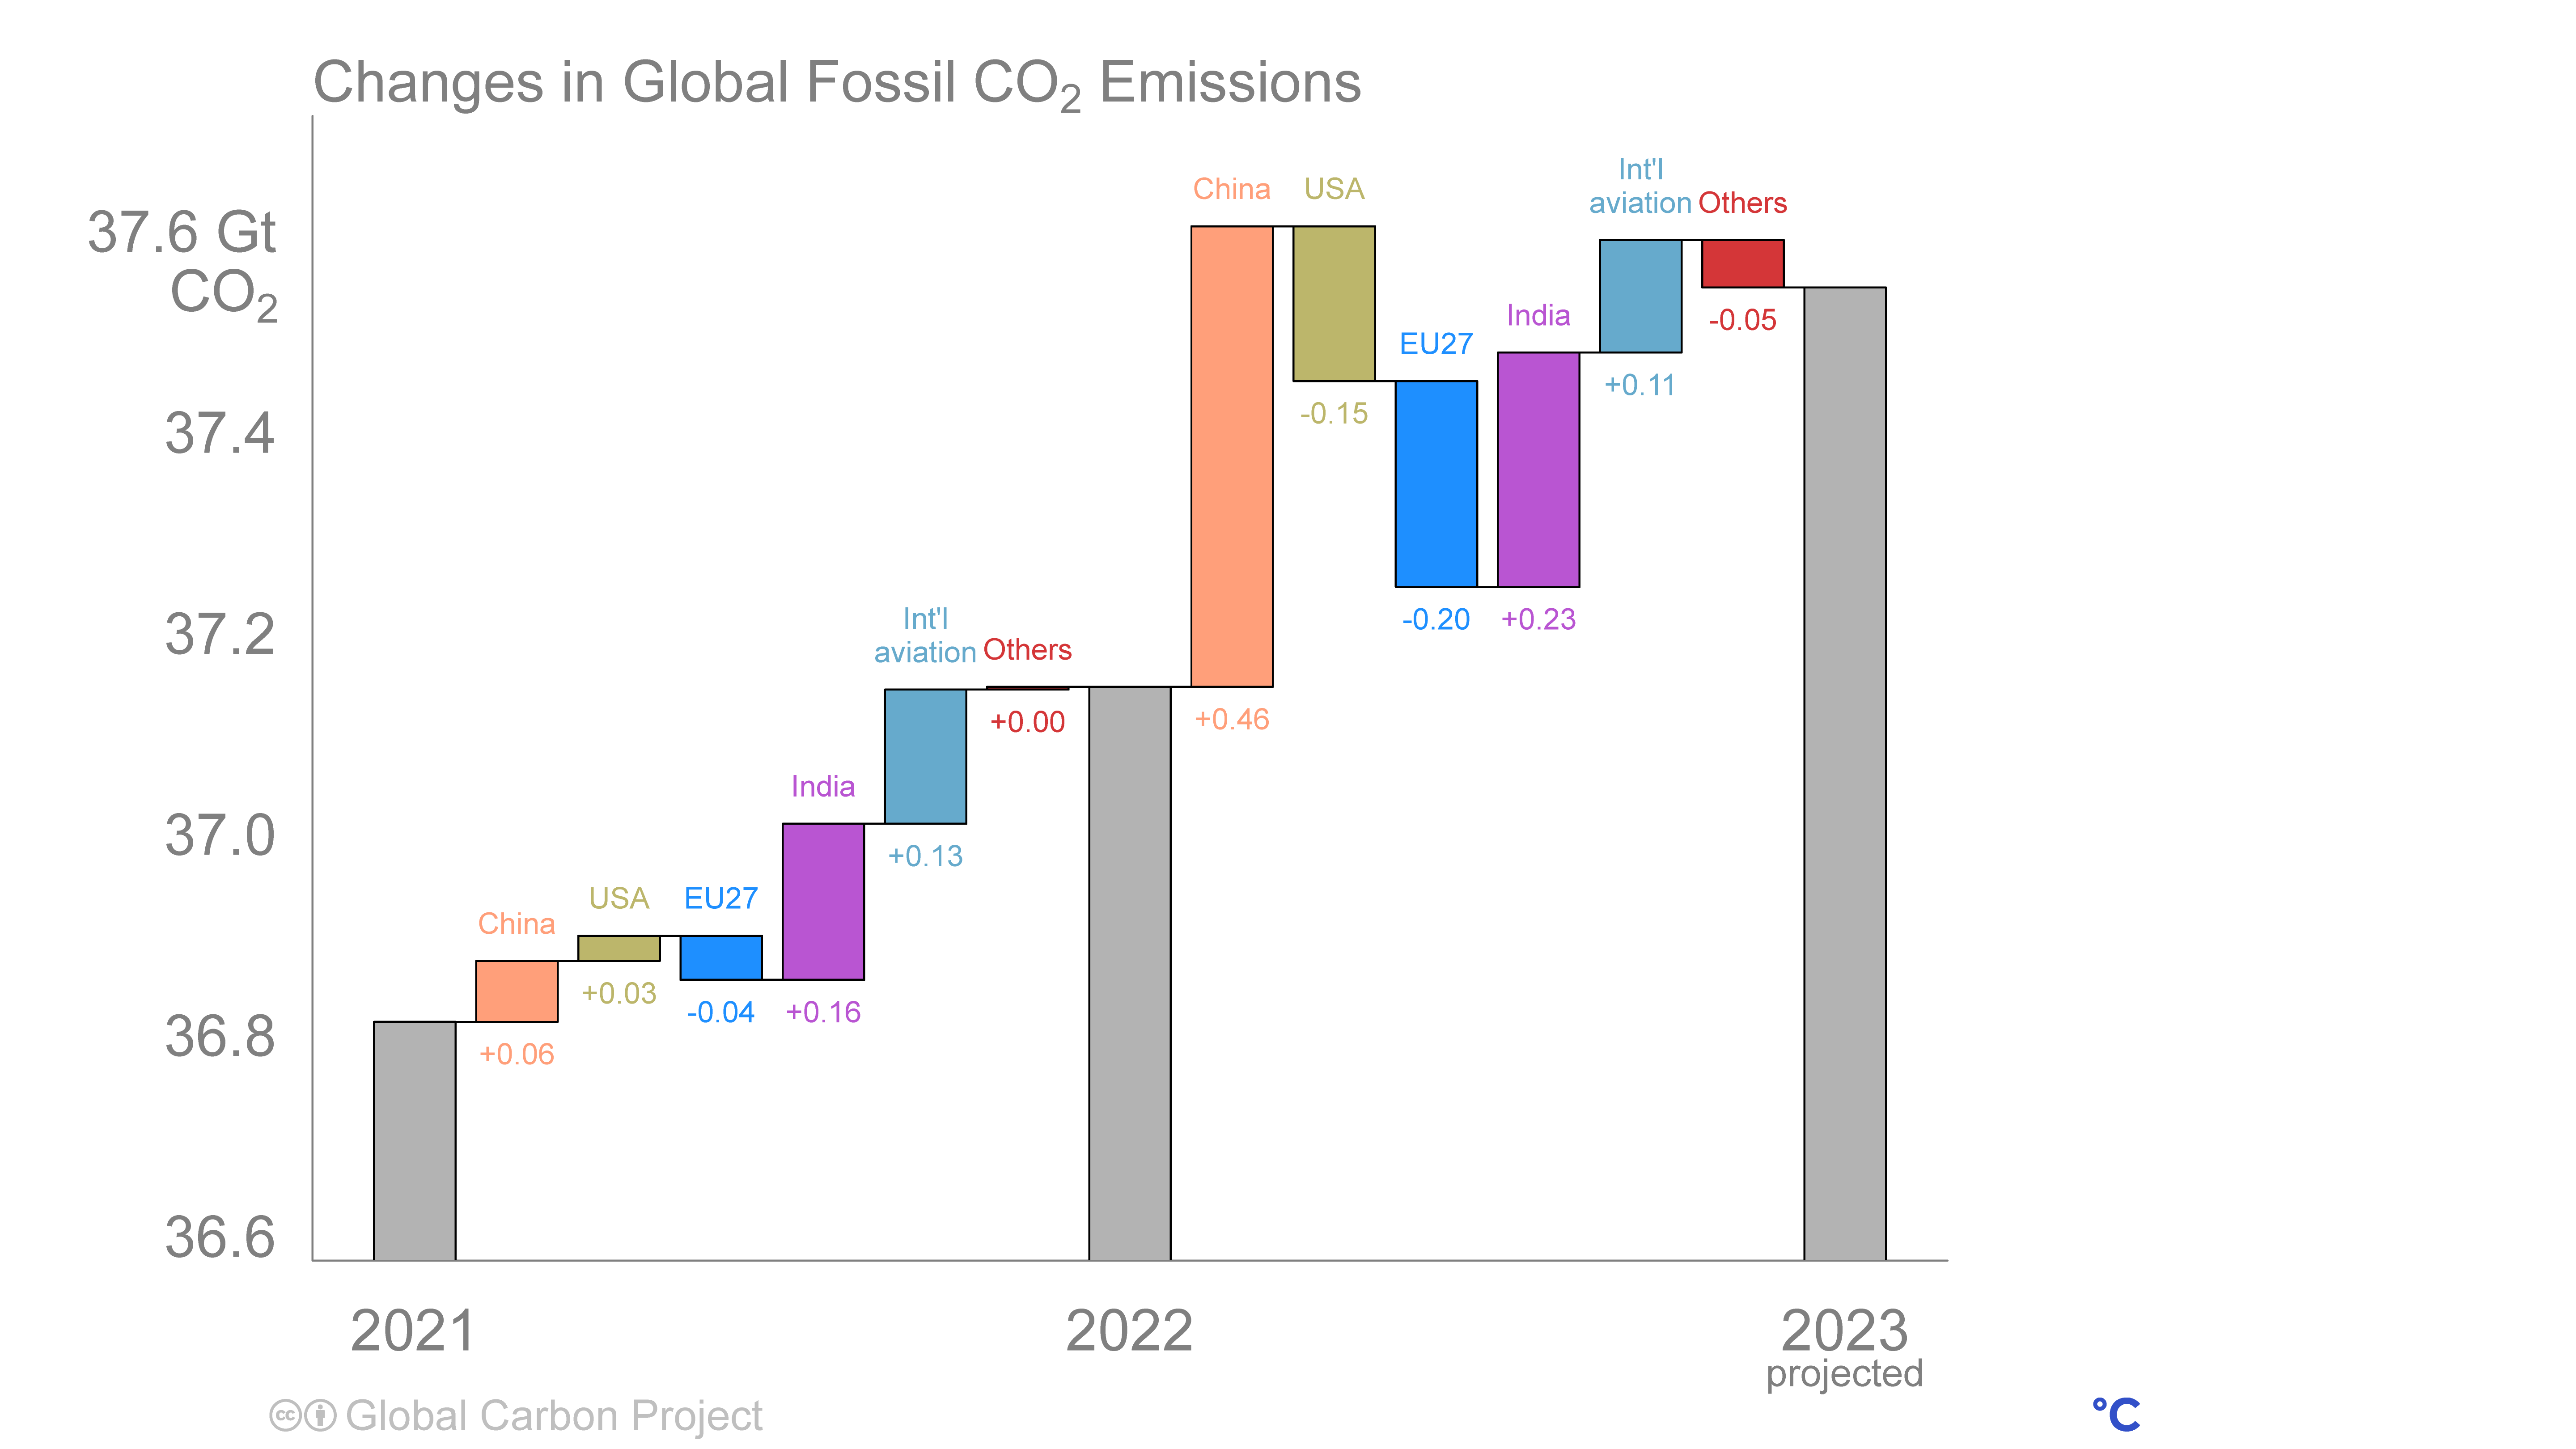
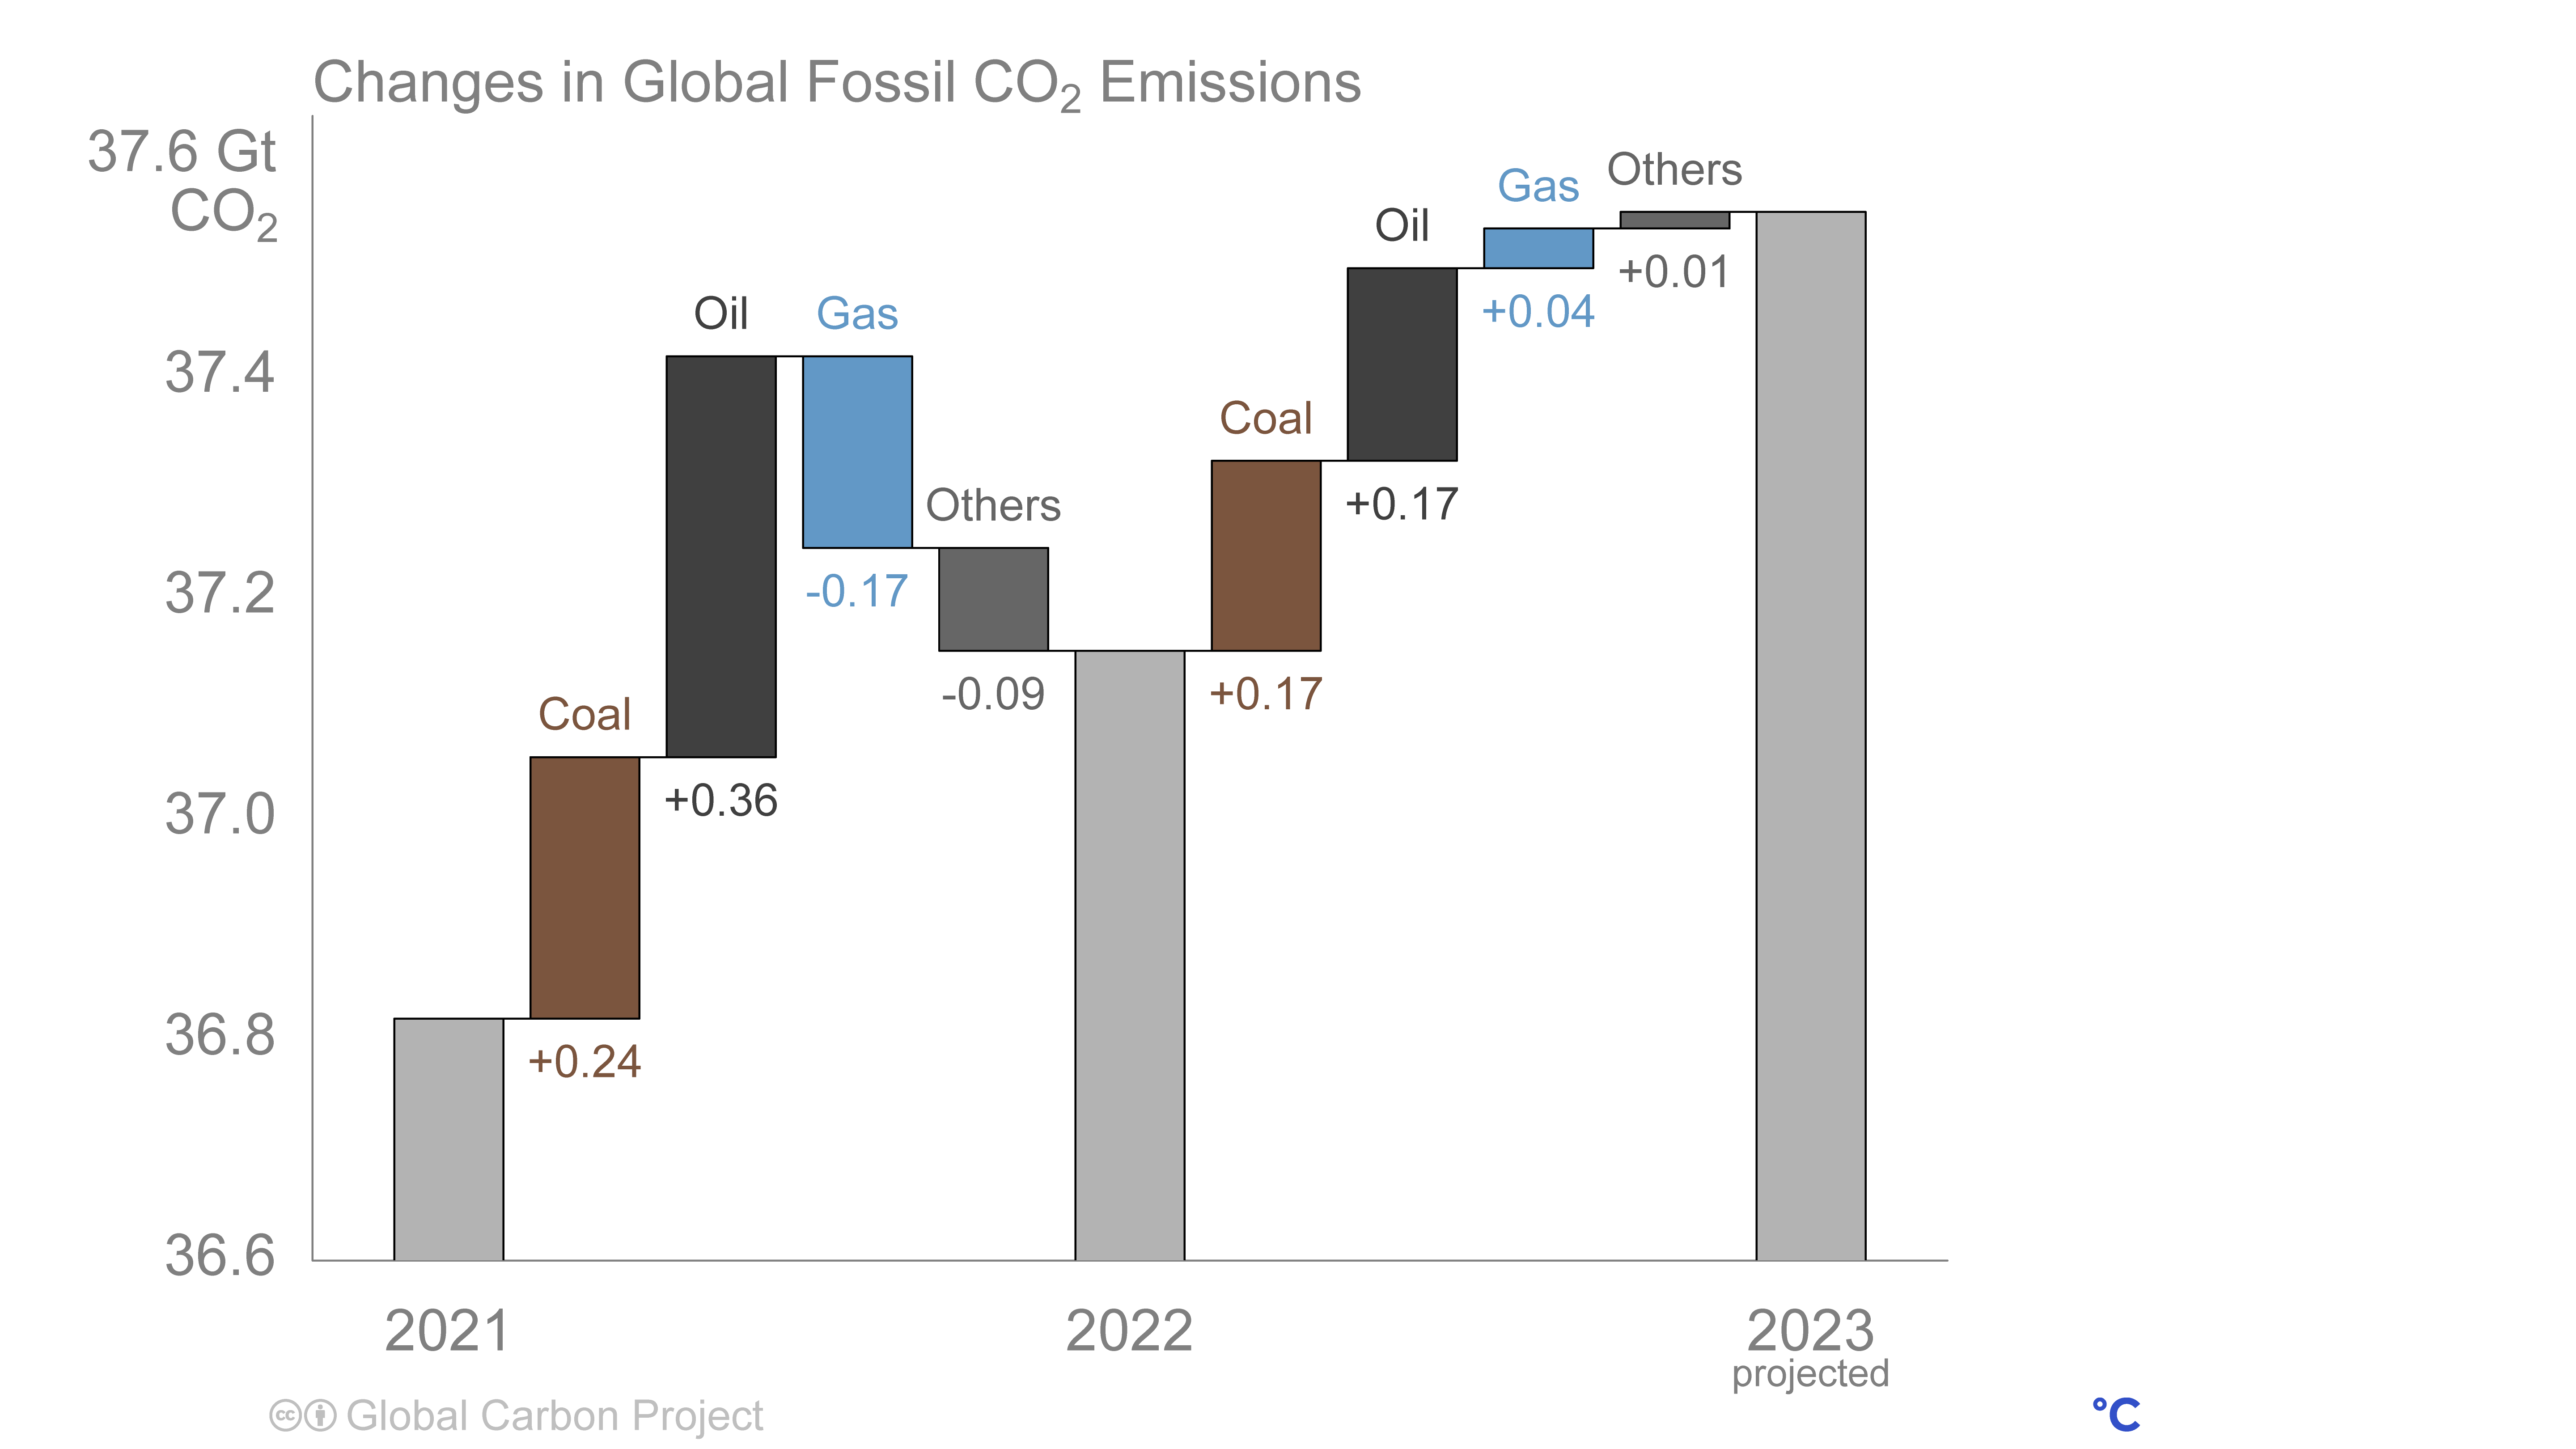
Changes in Global Fossil co₂ Emissions

Right click to download: PNG
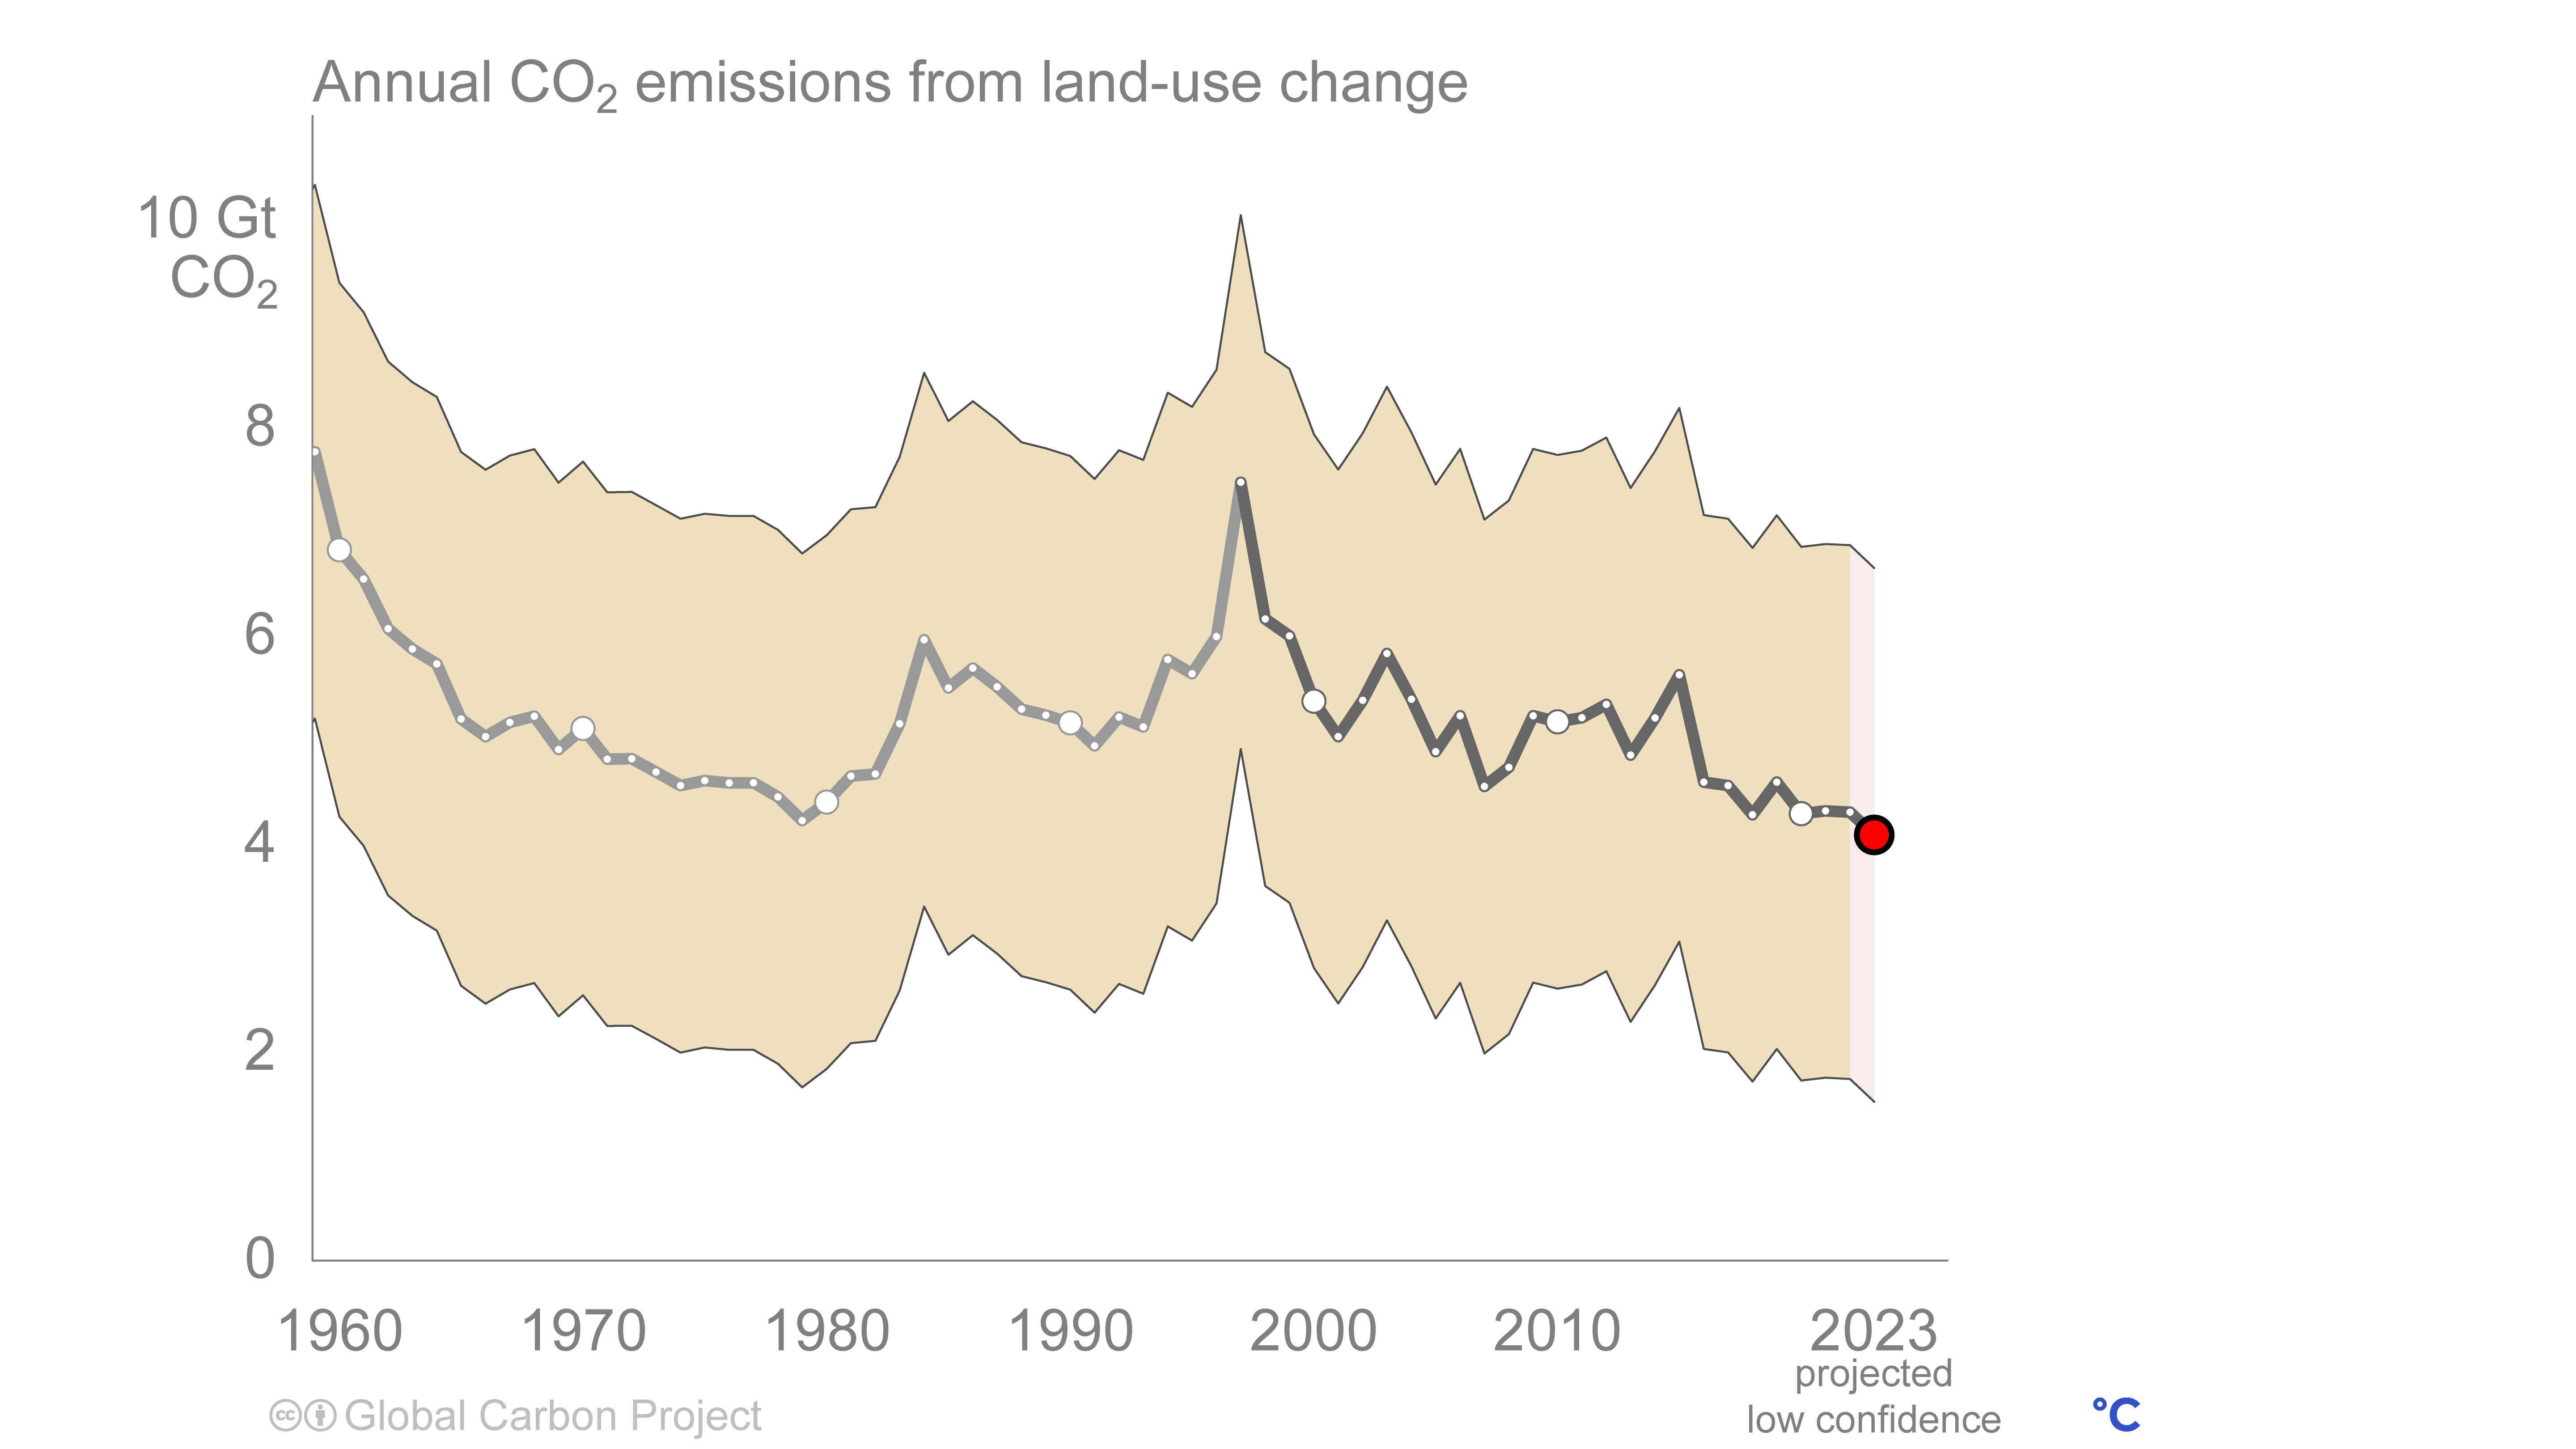
Annual co₂ emissions from land-use change

Right click to download: CSV / PNG
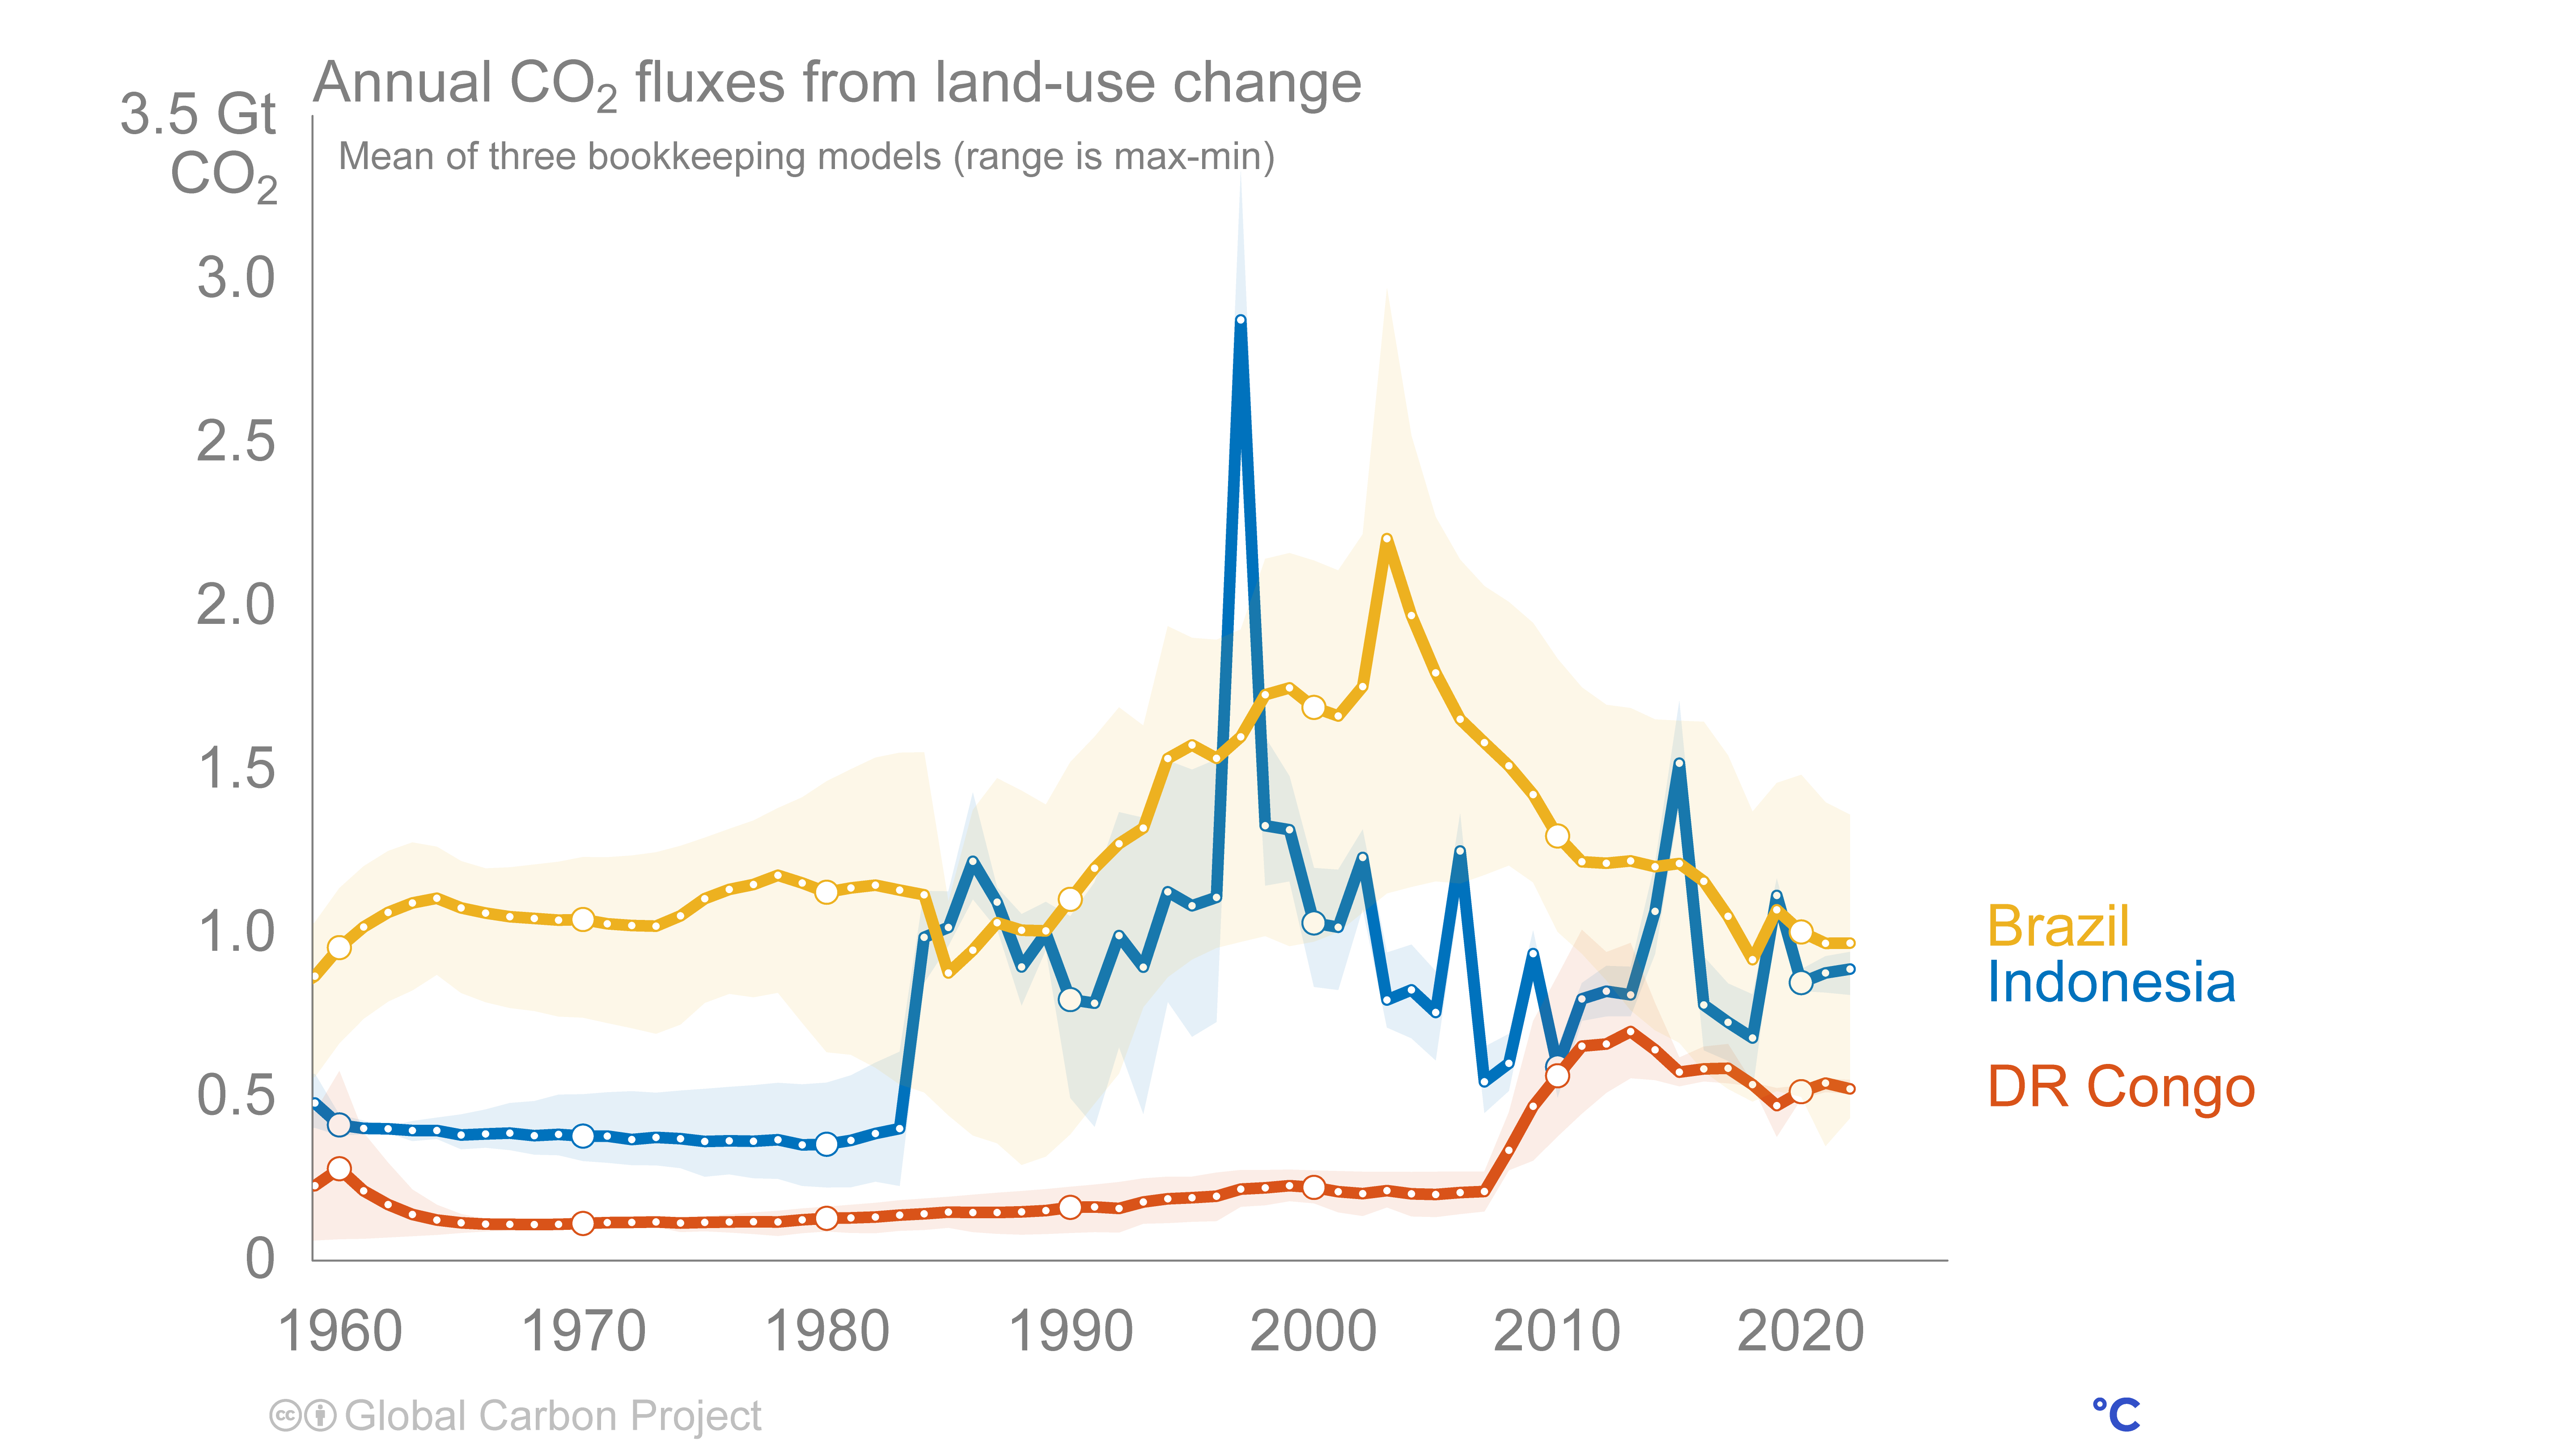
Annual co₂ fluxes from land-use change

Right click to download: PNG
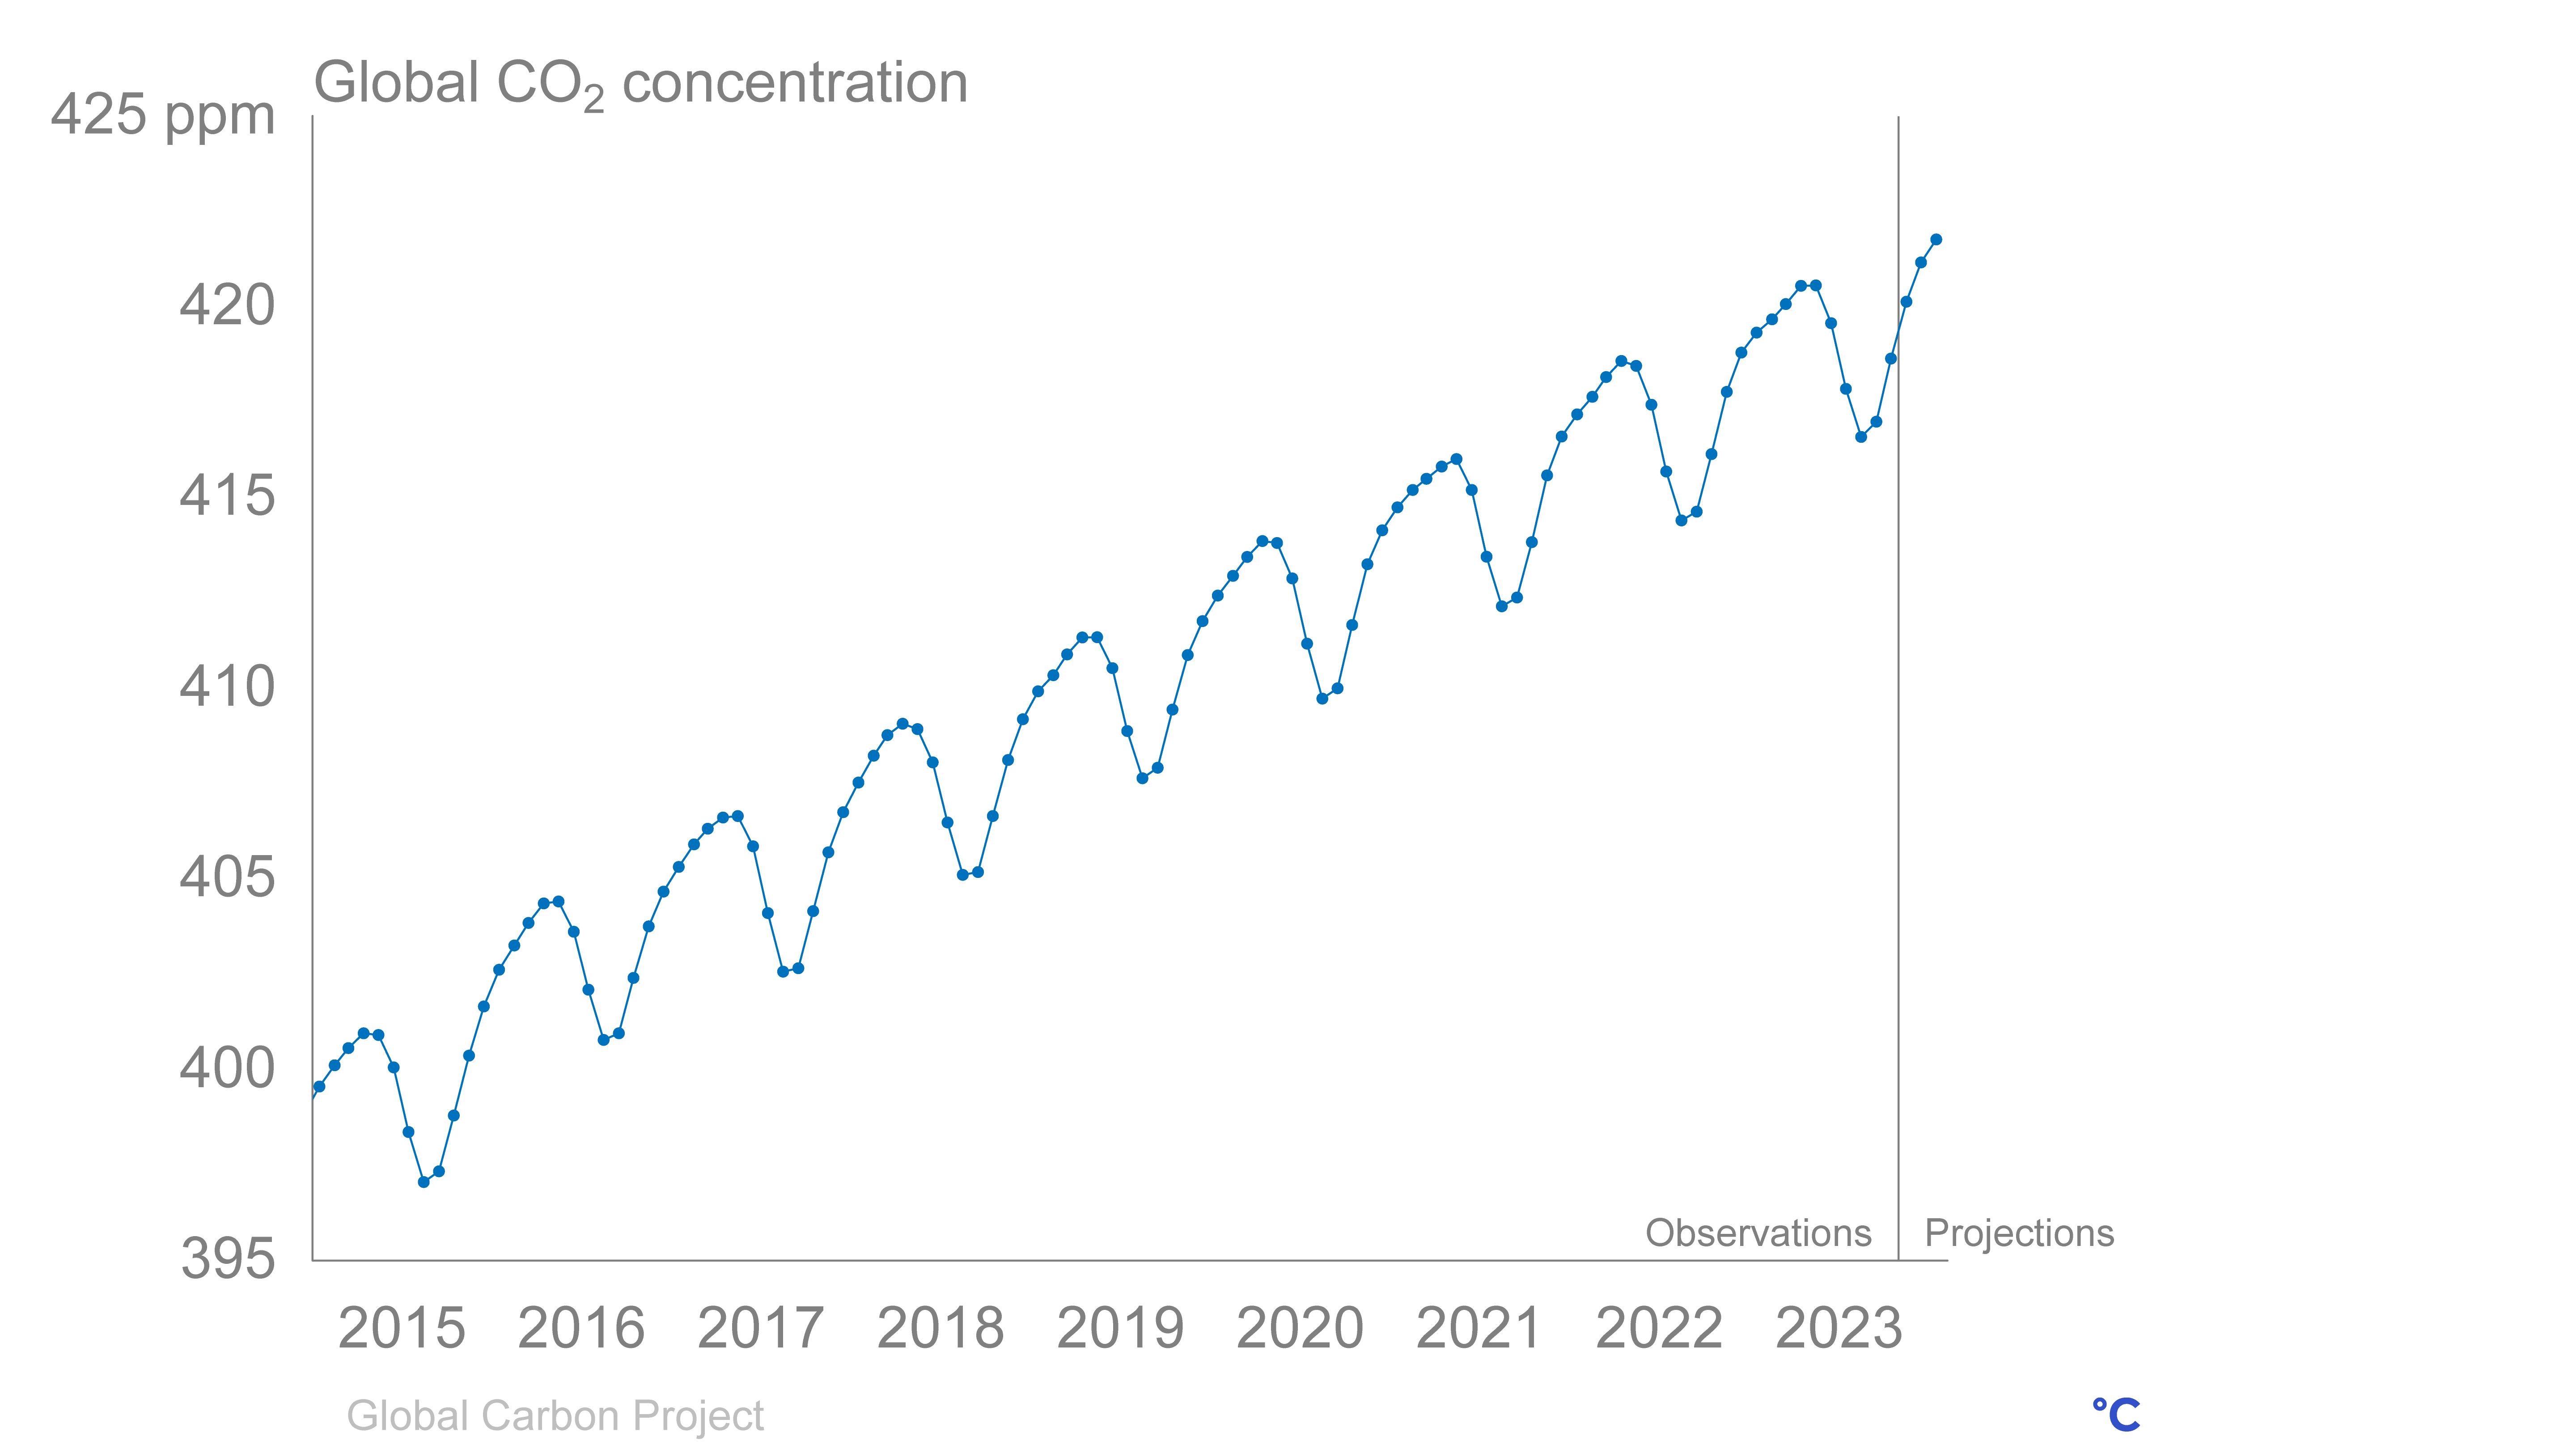
Global co₂ concentration

Right click to download: PNG
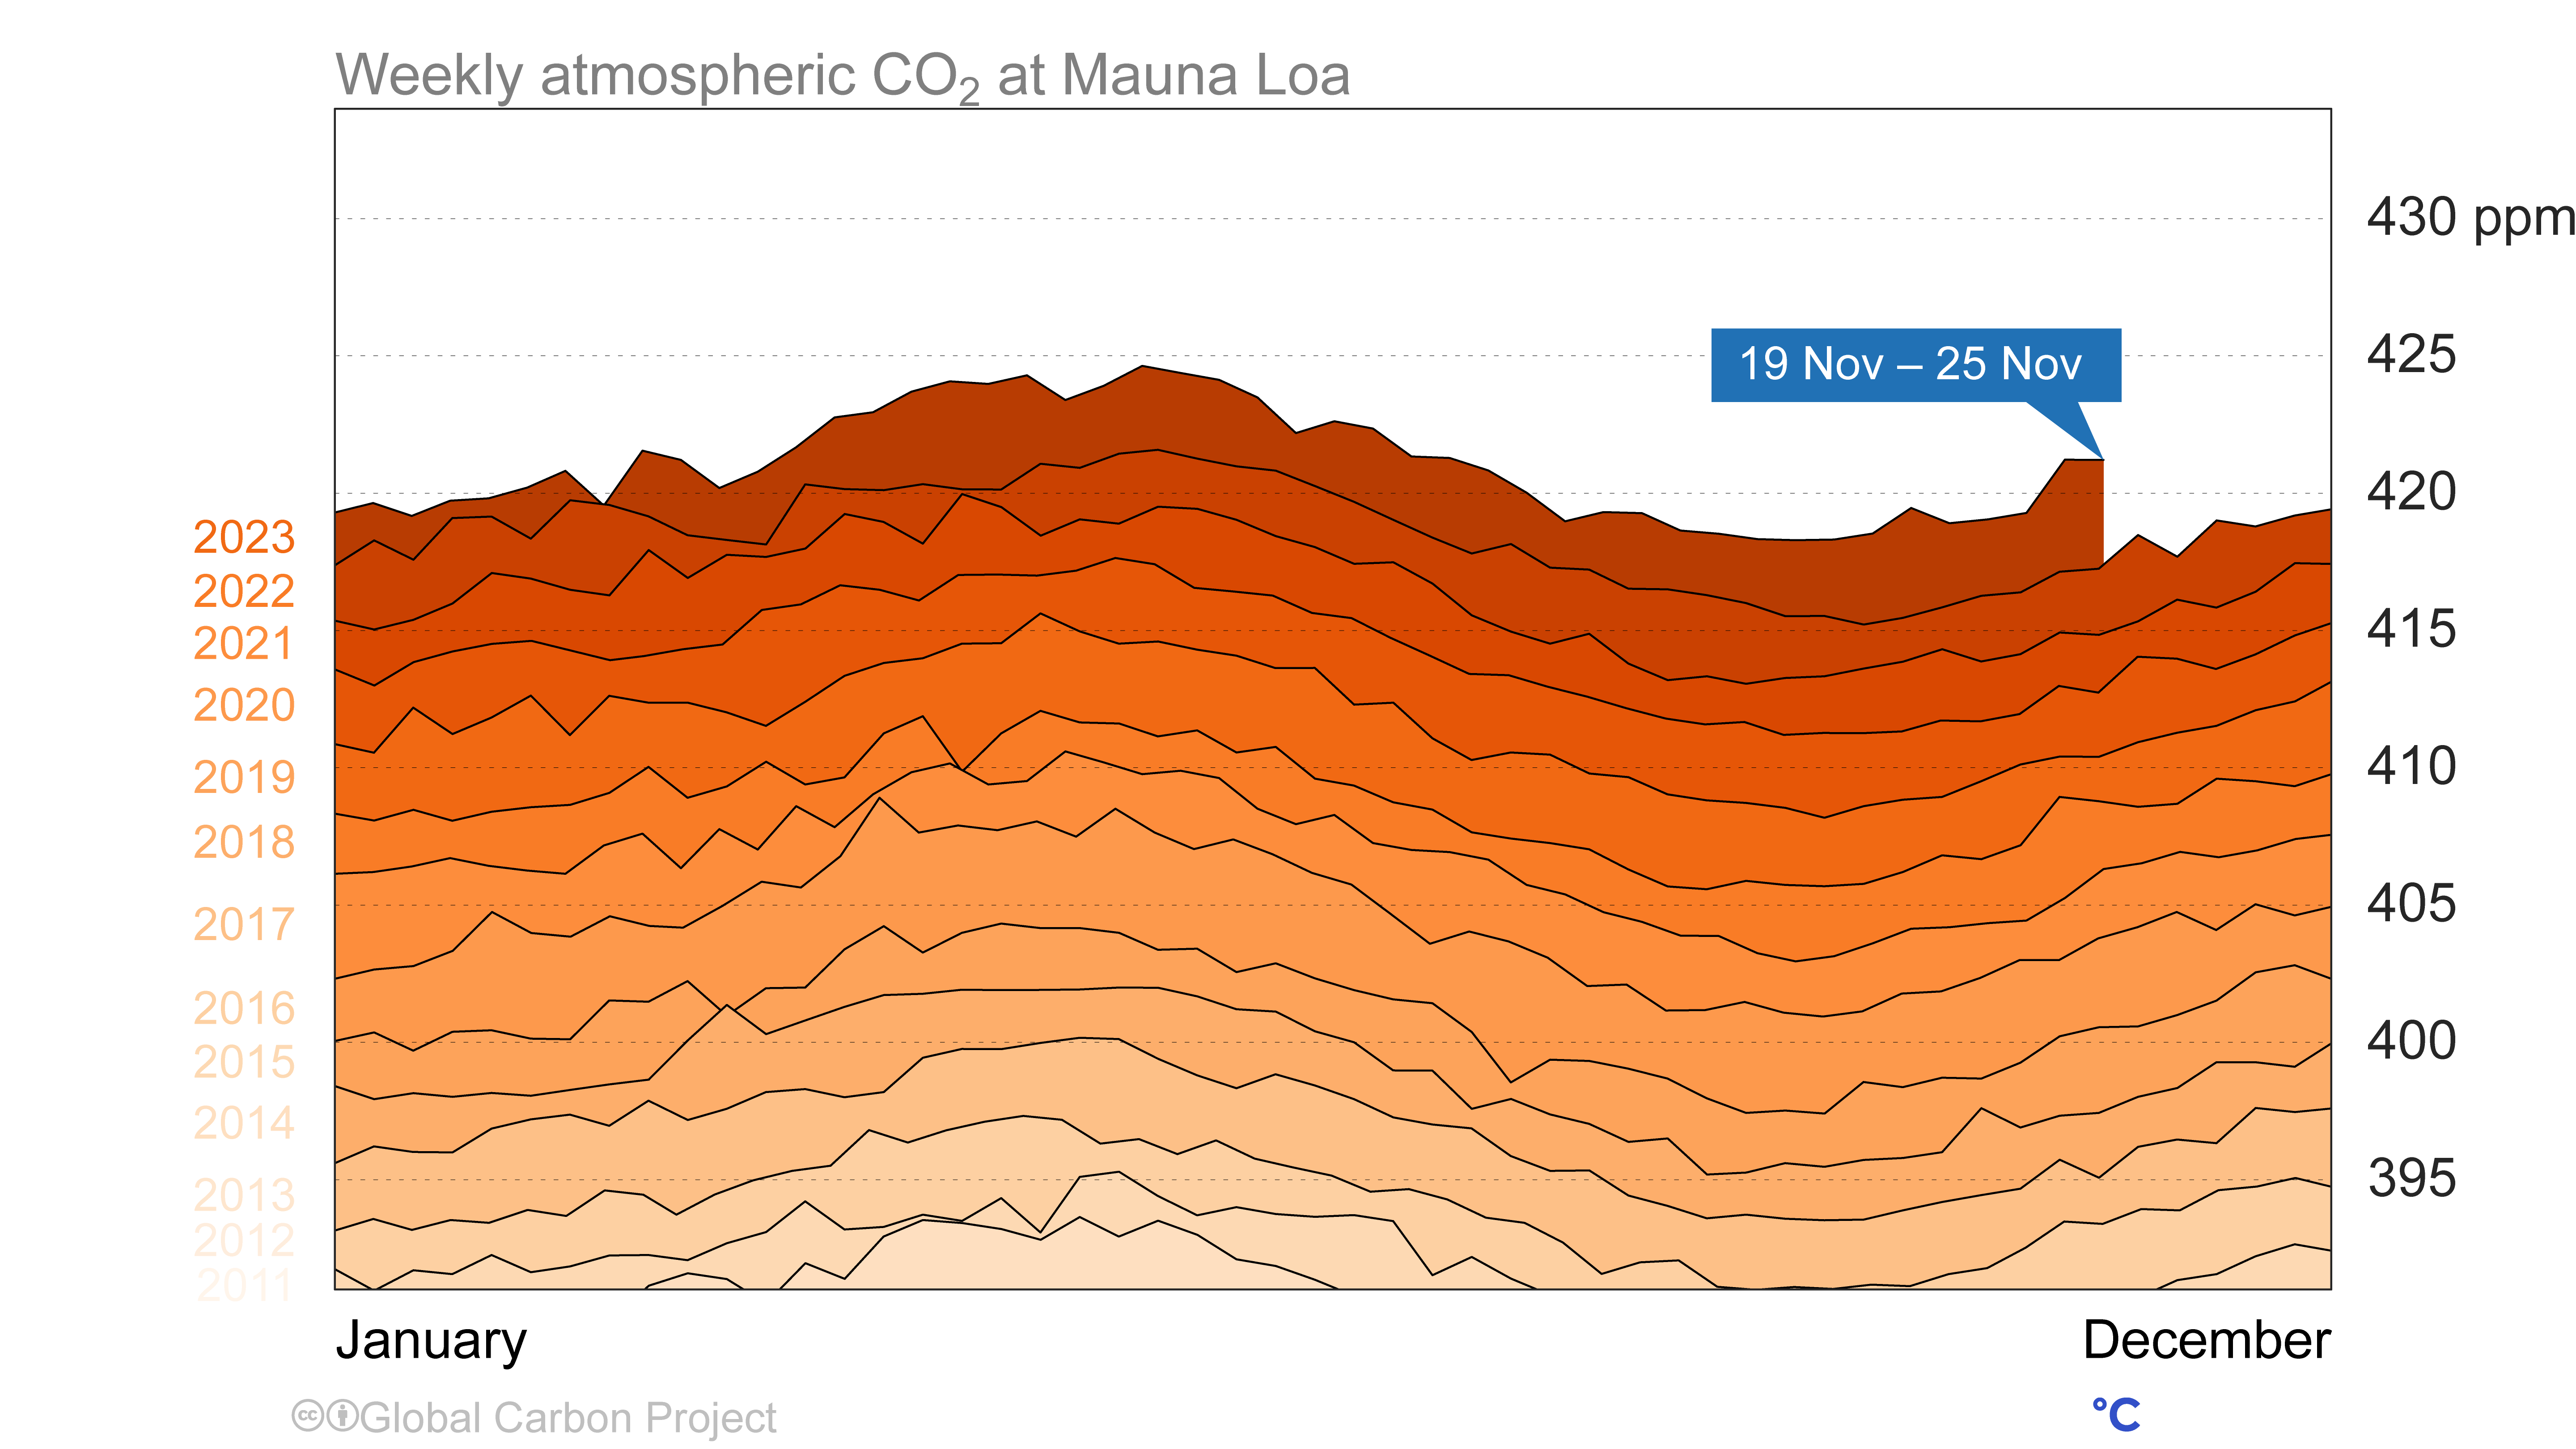
Weekly atmospheric co₂ at Mauna Loa

Right click to download: PNG
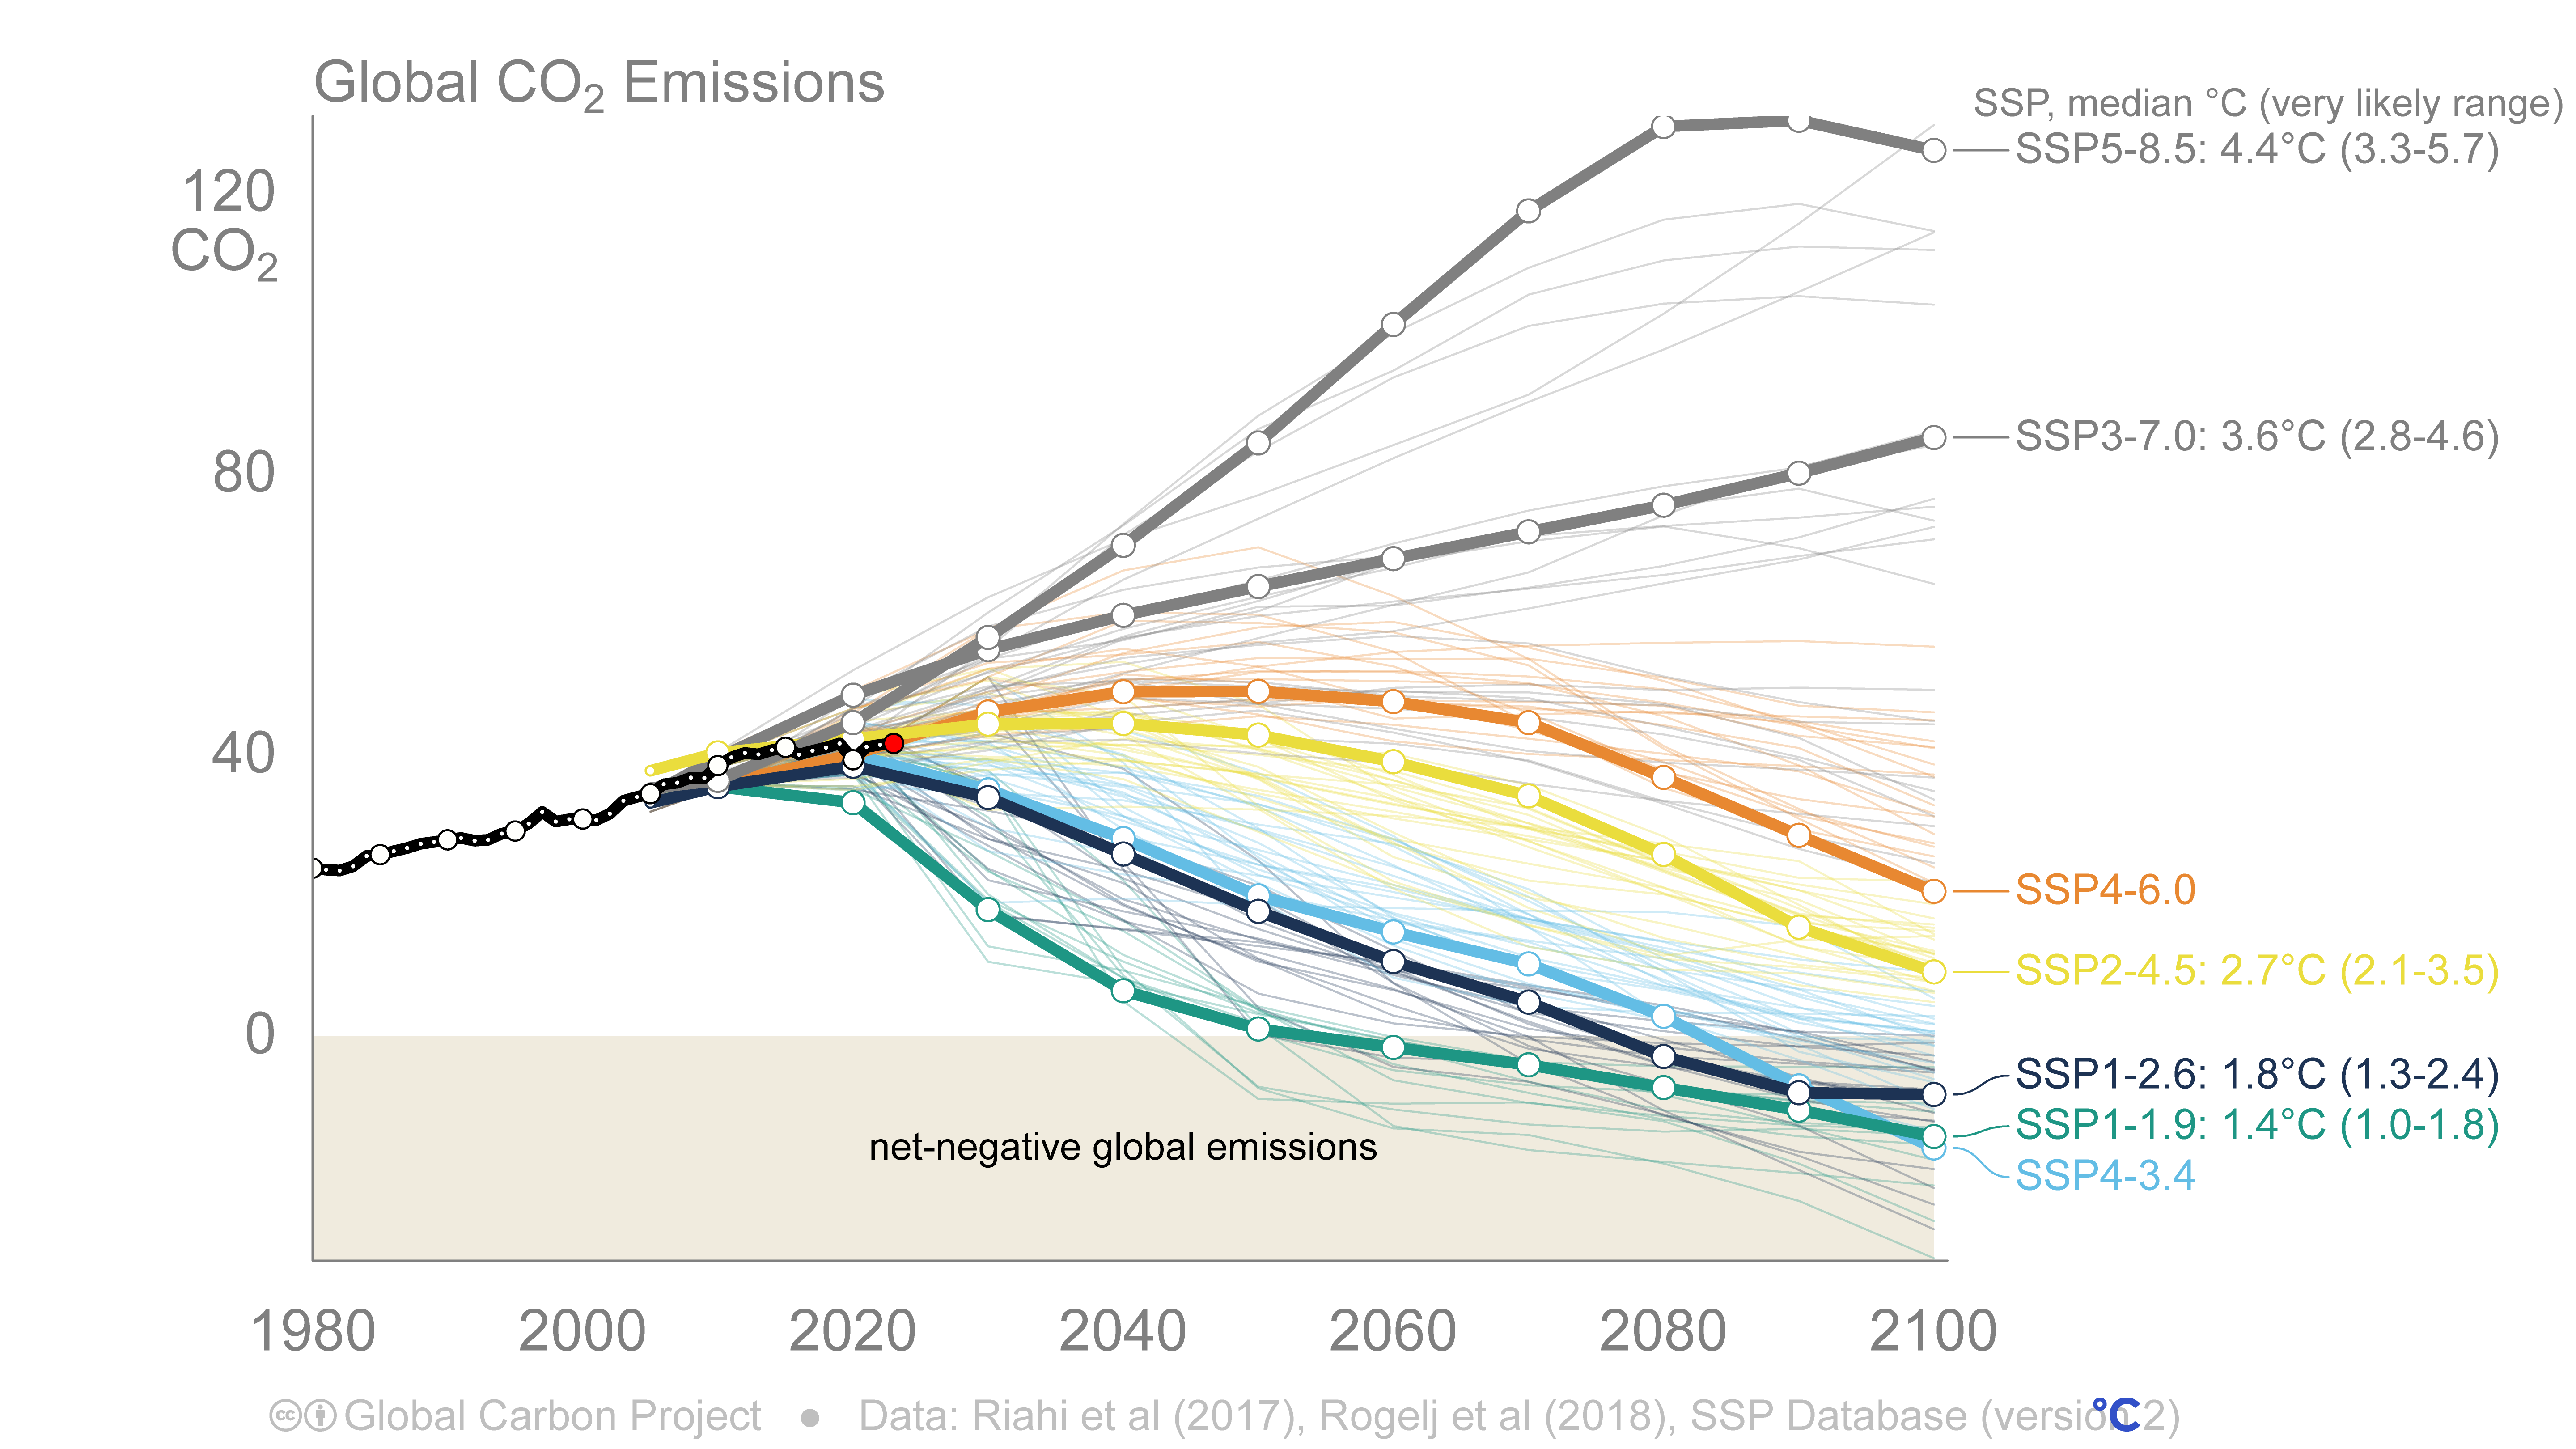
Shared Socioeconomic Pathways

Right click to download: PNG
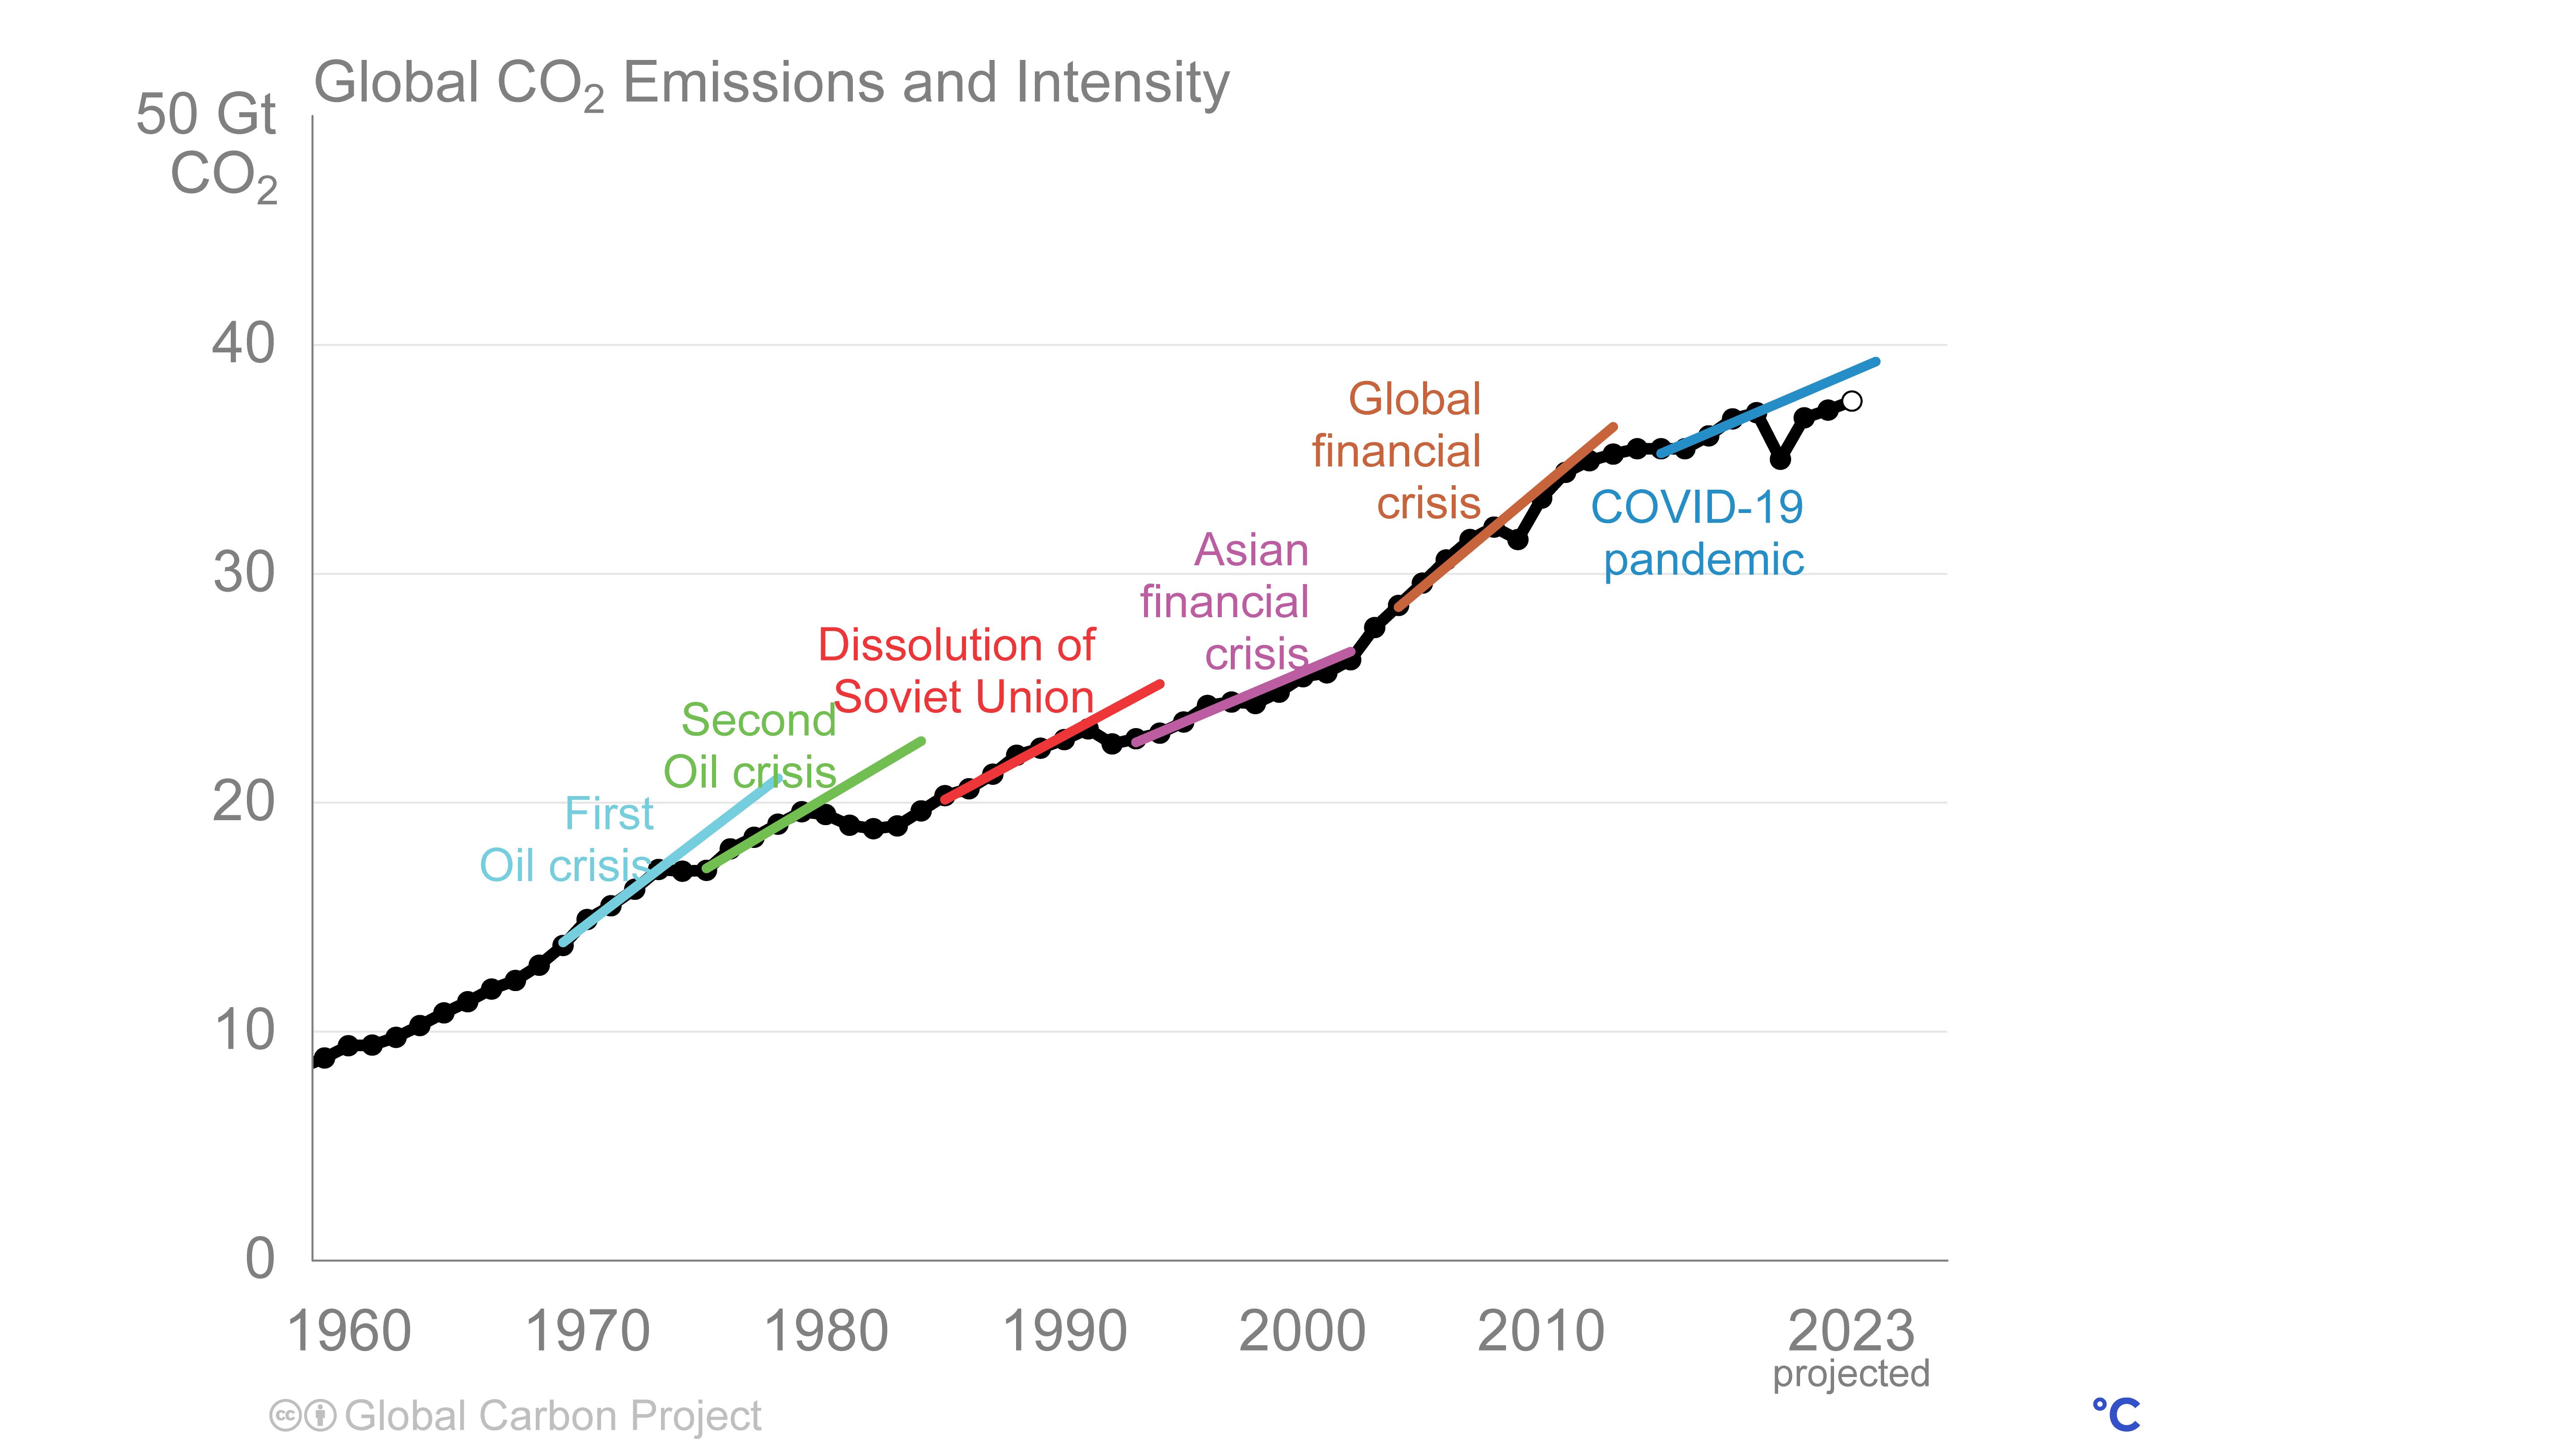
Global co₂ Emissions and Intensity

Right click to download: CSV / PNG
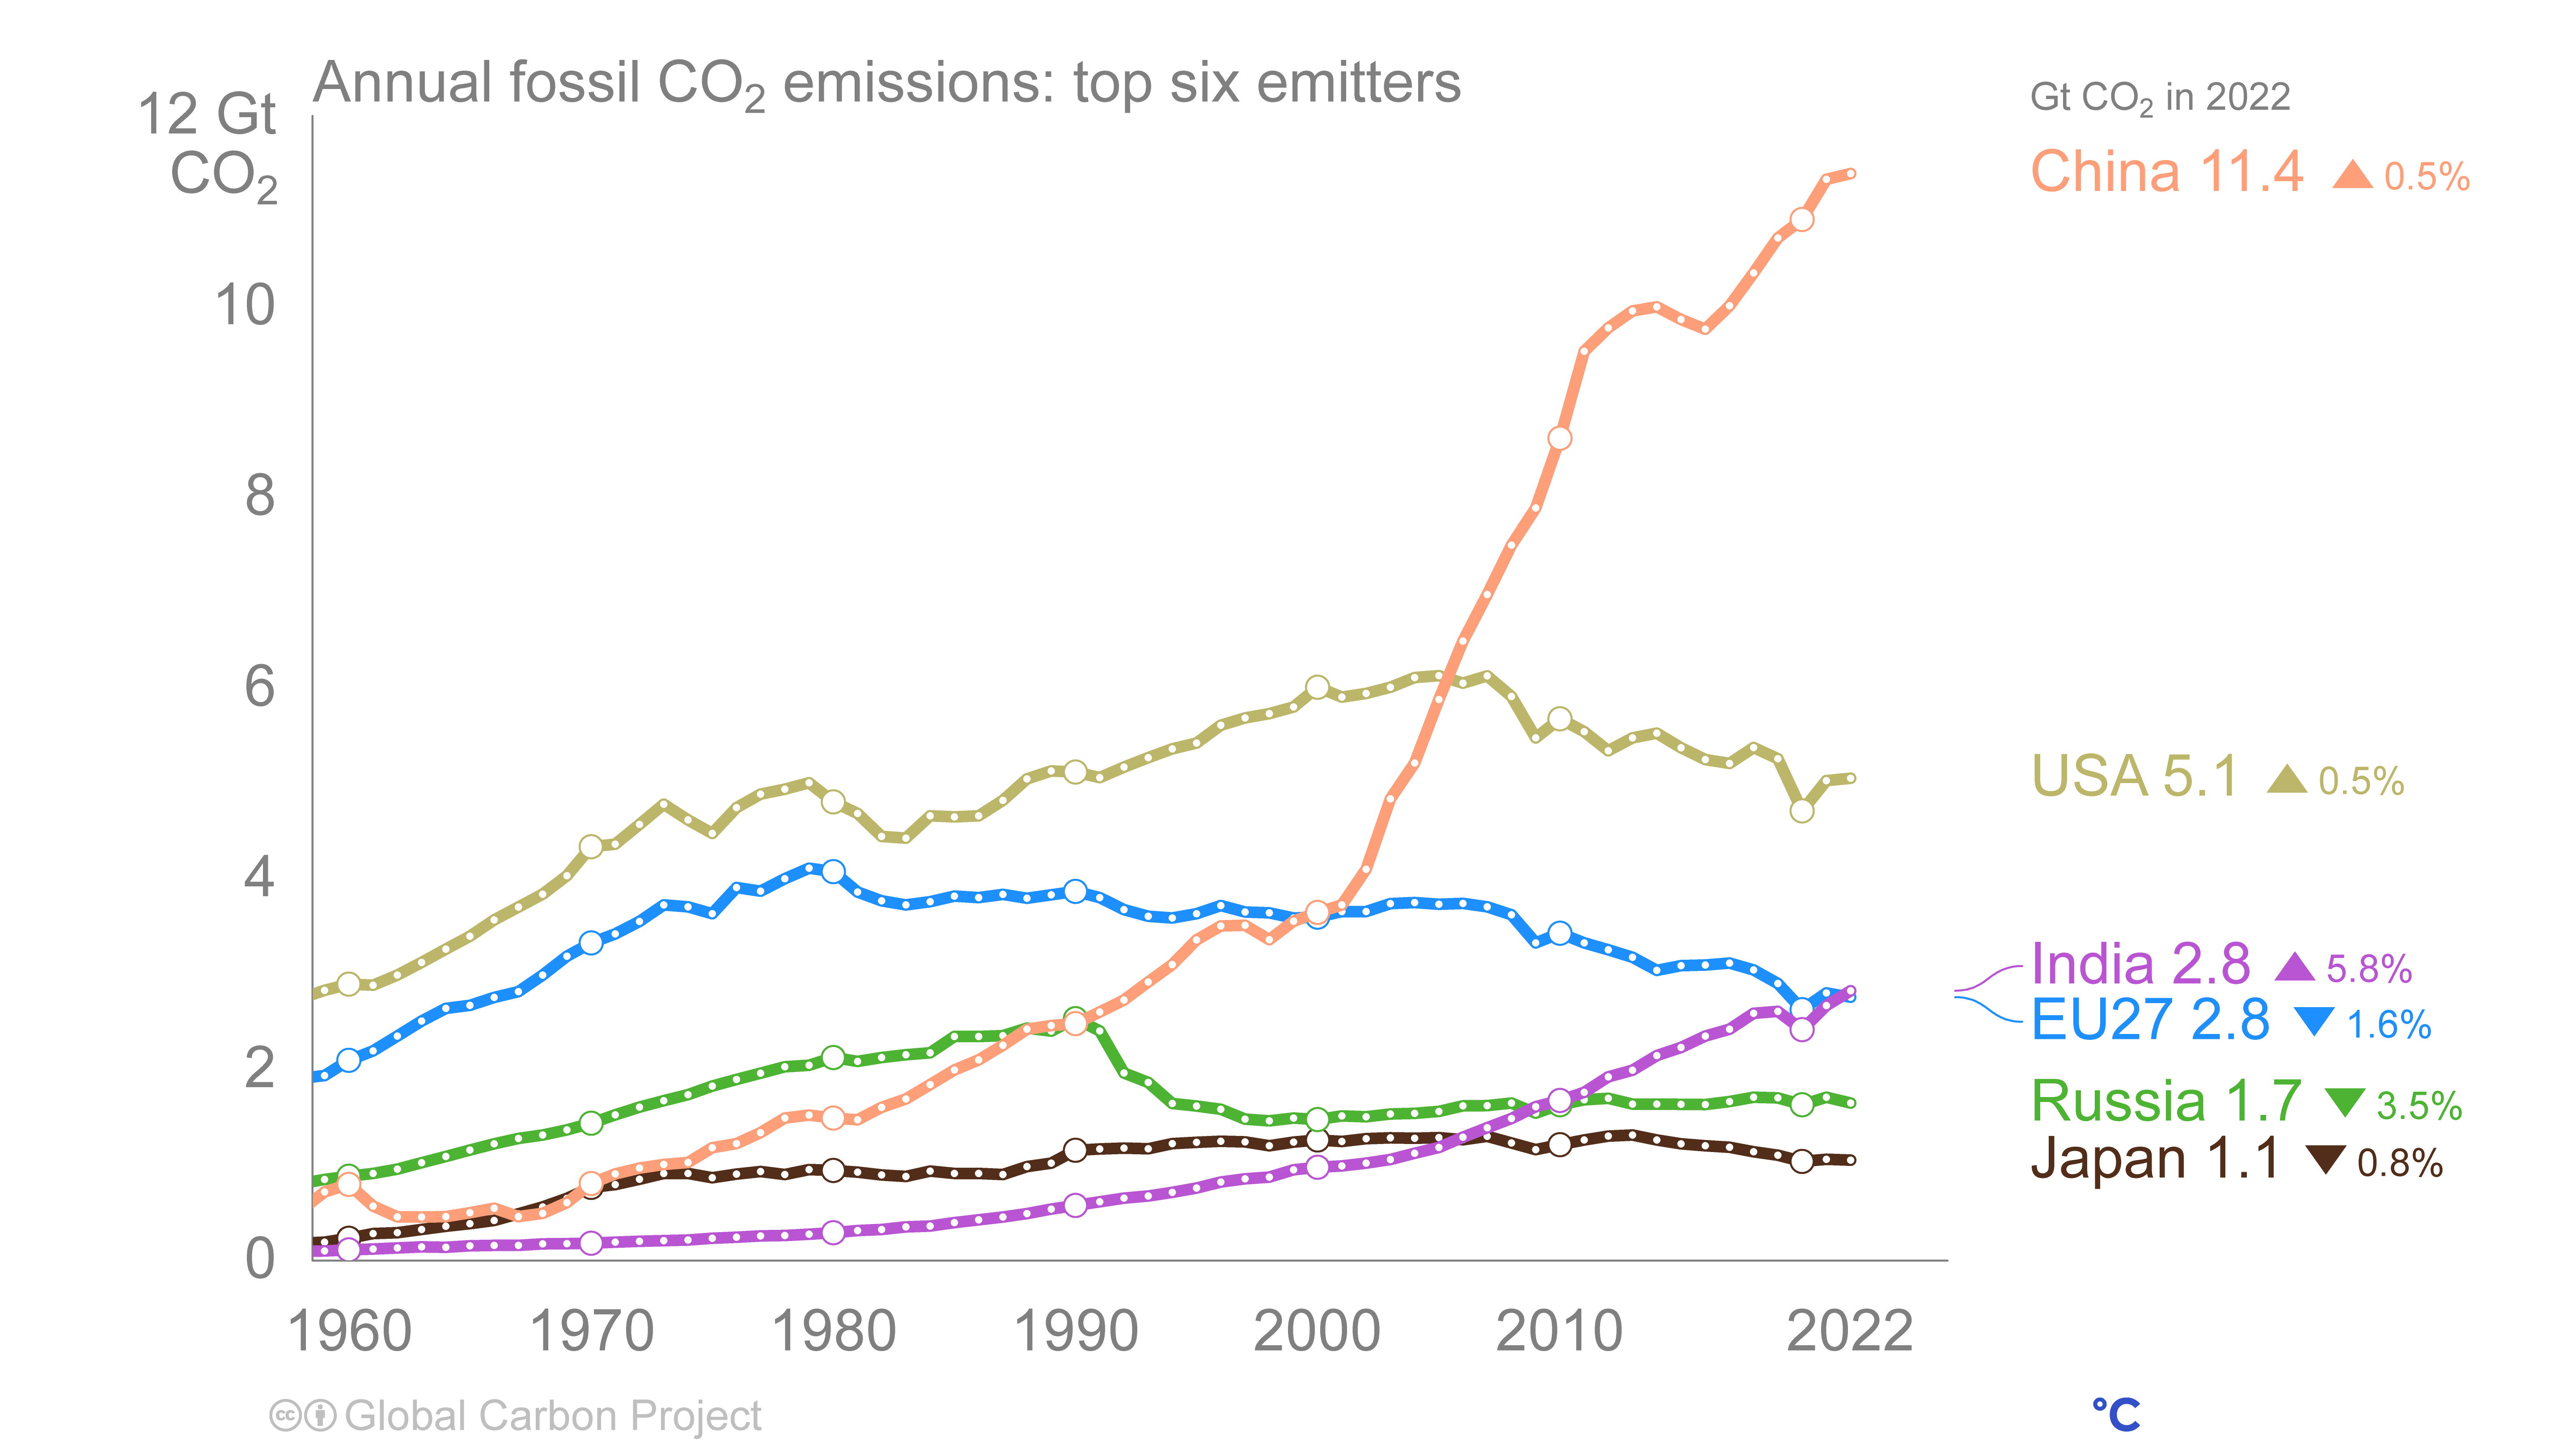
Annual fossil co₂ emissions: top six emitters

Right click to download: CSV / PNG
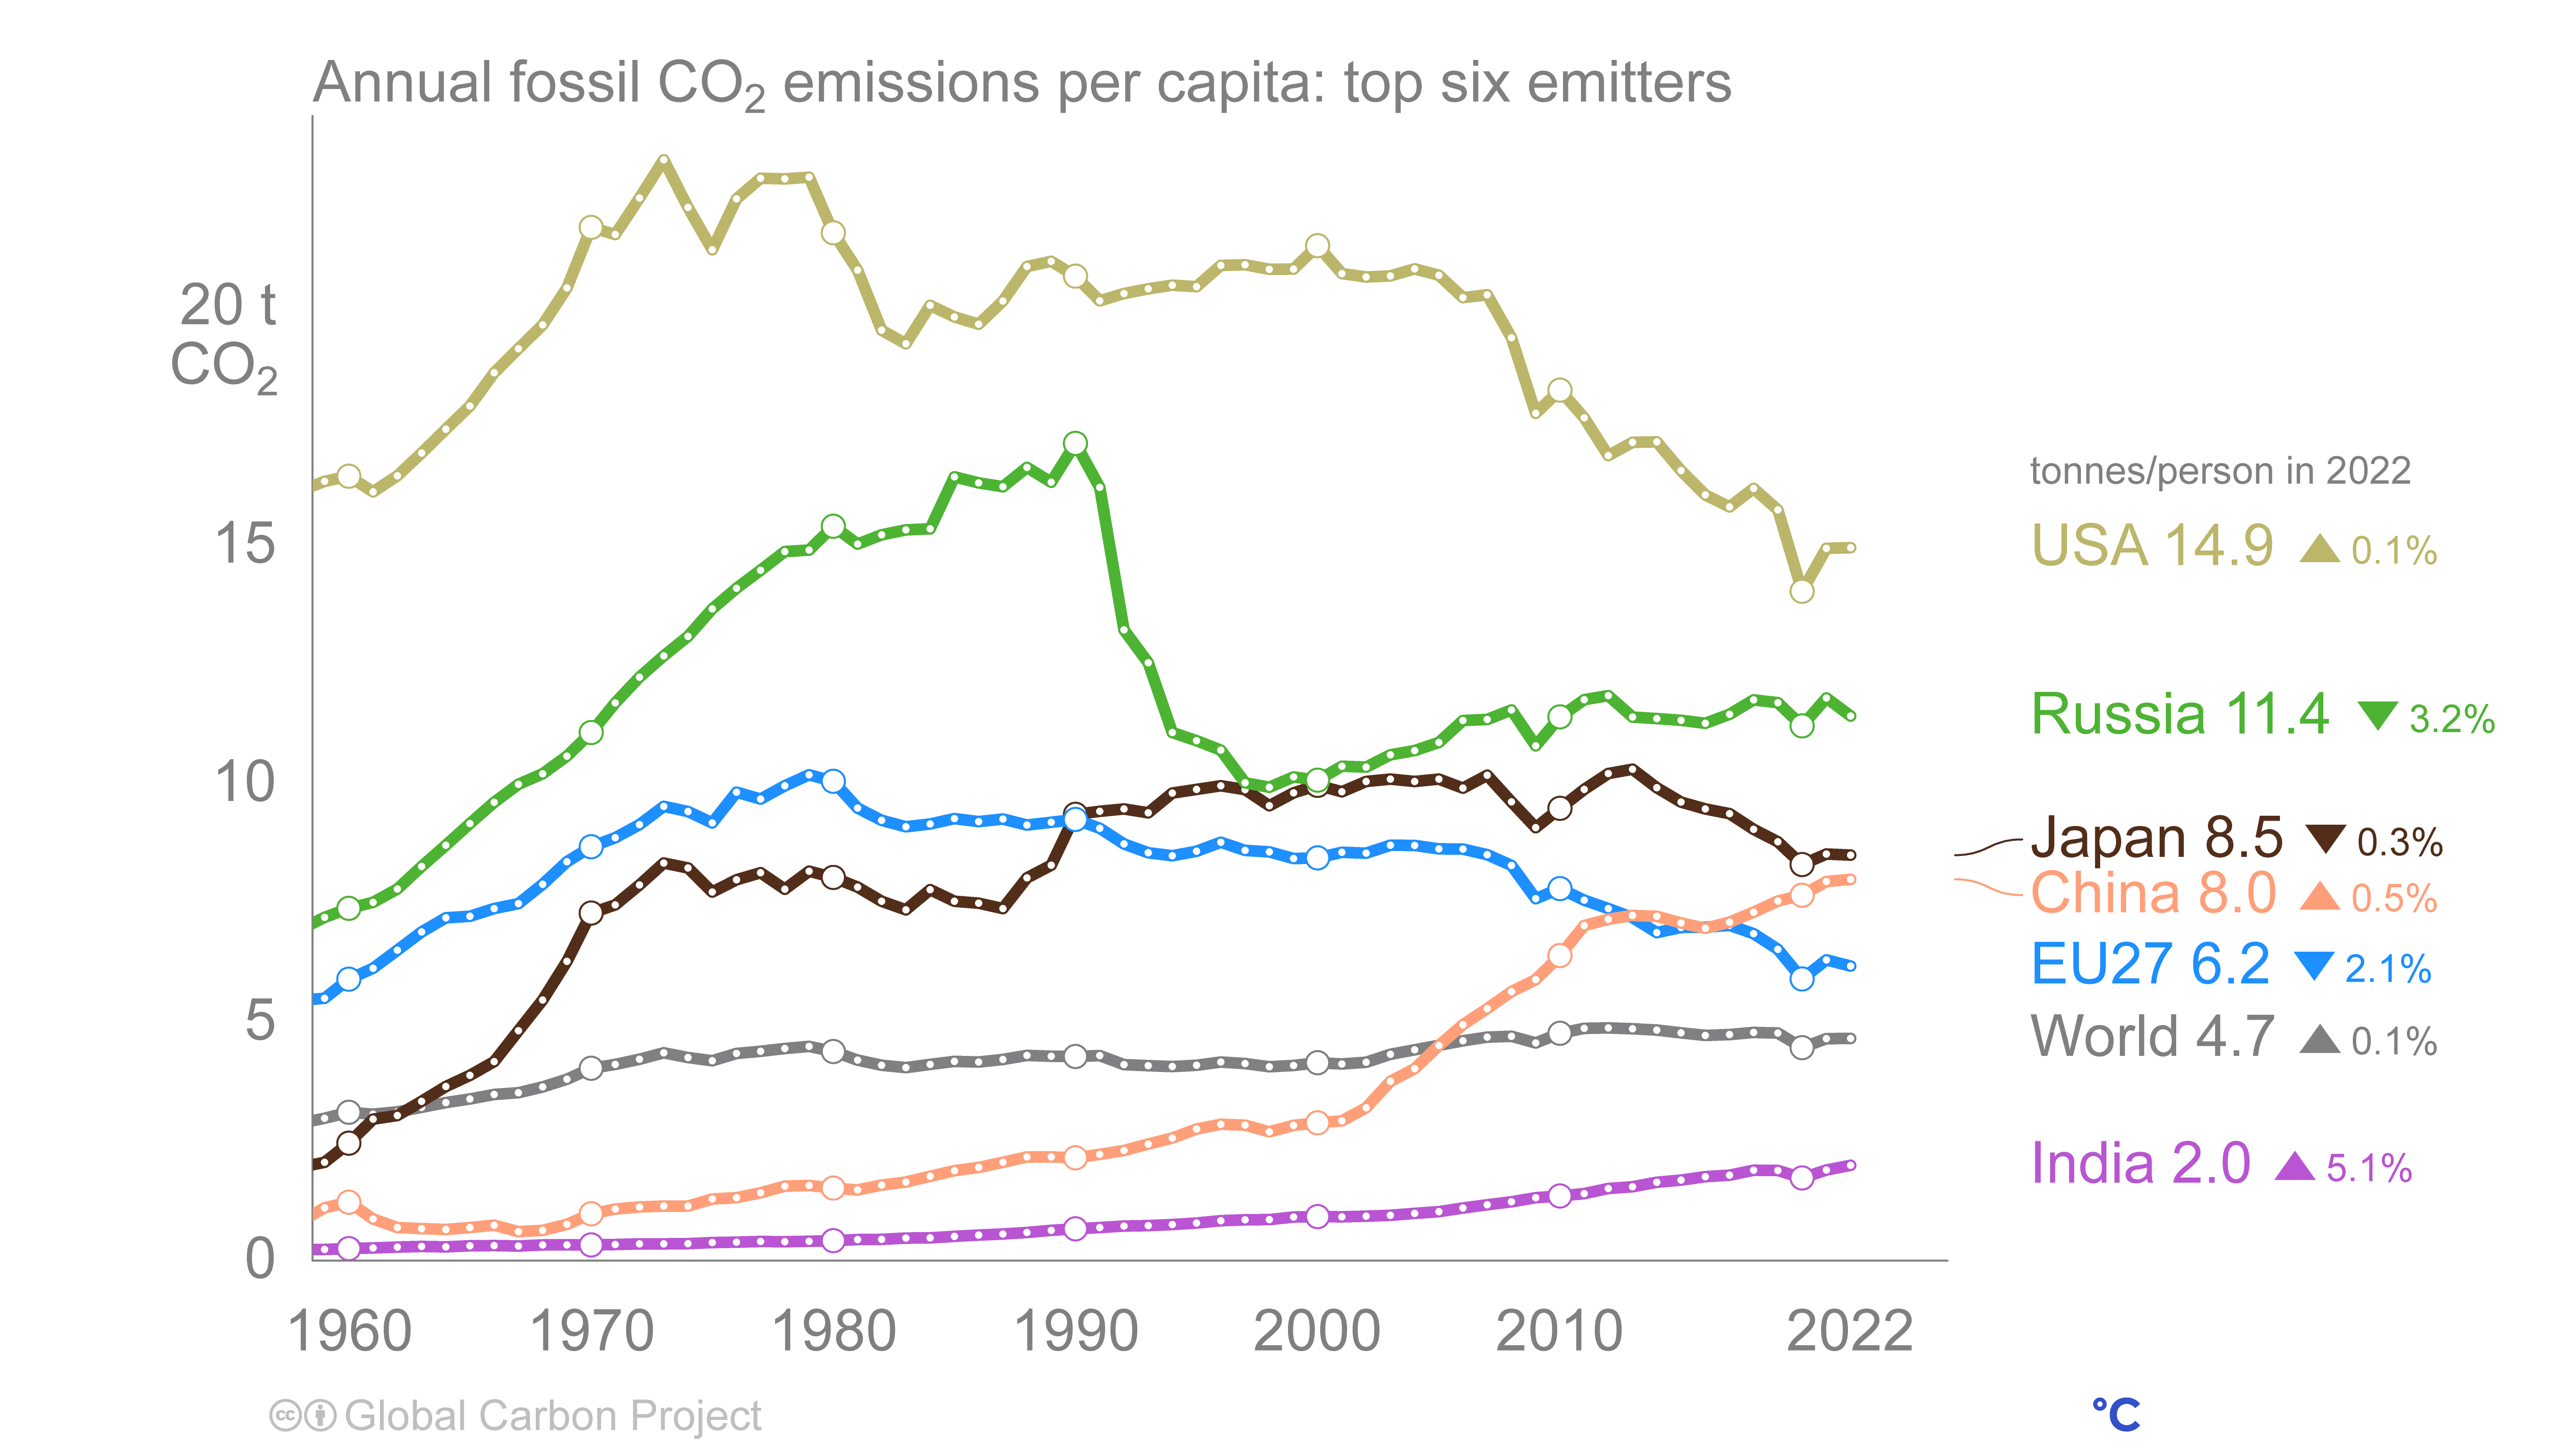
Annual fossil co₂ emissions per capita: top six emitters

Right click to download: CSV / PNG
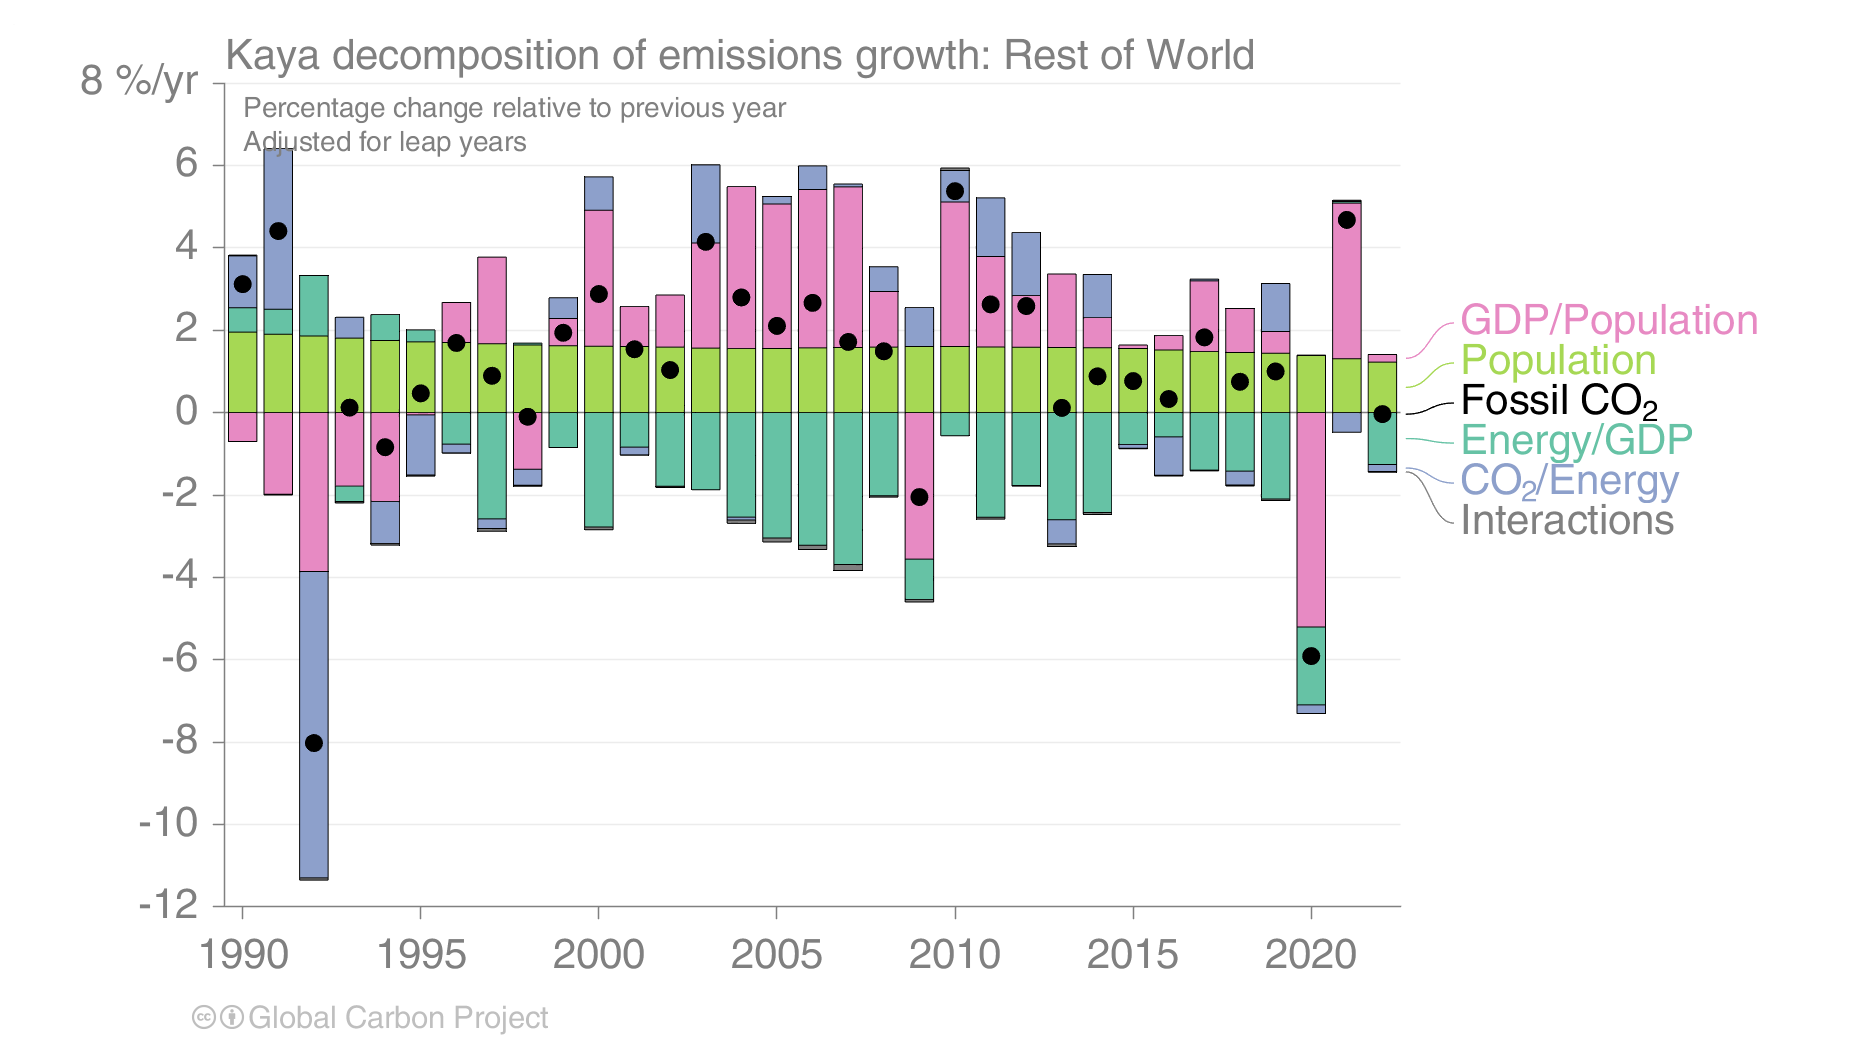
Kaya decomposition of emissions growth: Rest of World

Right click to download: CSV / PNG
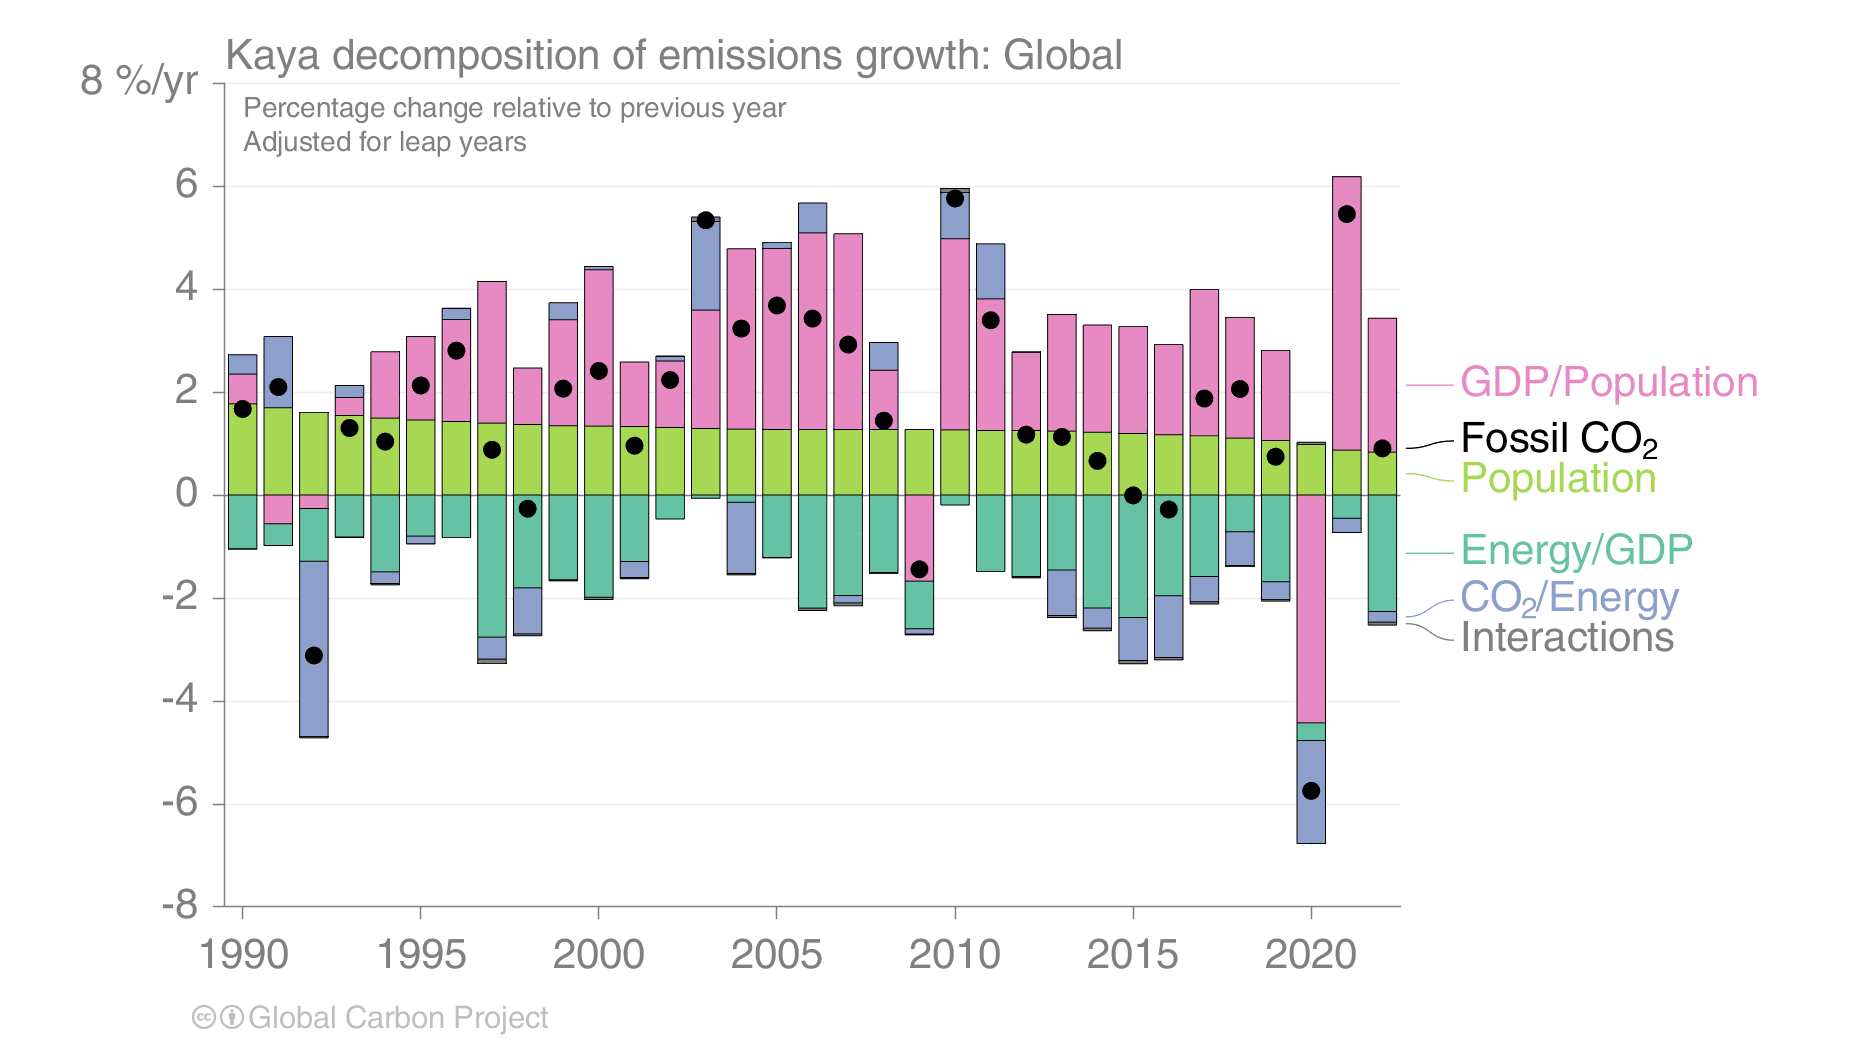
Kaya decomposition of emissions growth: Global

Right click to download: CSV / PNG
Historical cumulative fossil co₂ emissions since 1850
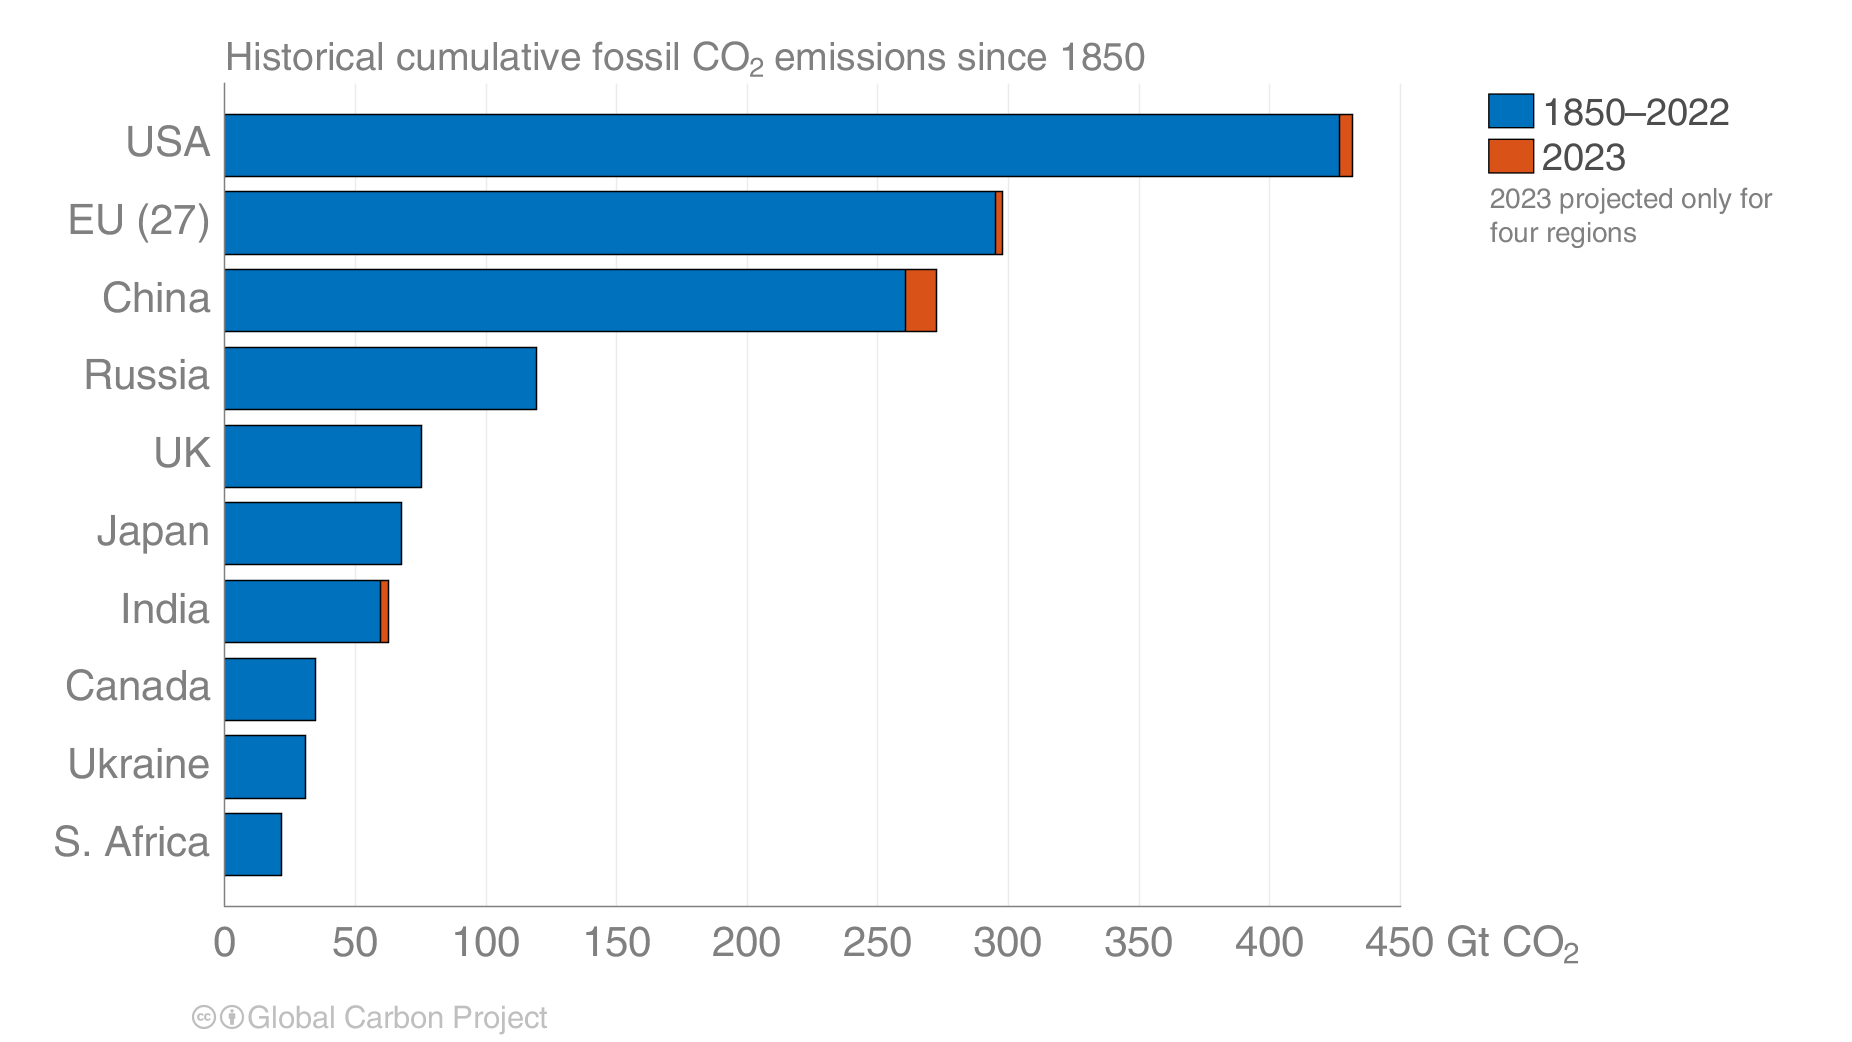
Right click to download: PNG
Annual Fossil co₂ Emissions: Global

Right click to download: PNG
Changes in Global Fossil co₂ Emissions

Right click to download: PNG
Global Annual Fossil co₂ Emissions, 2000-23

Right click to download: CSV / PNG
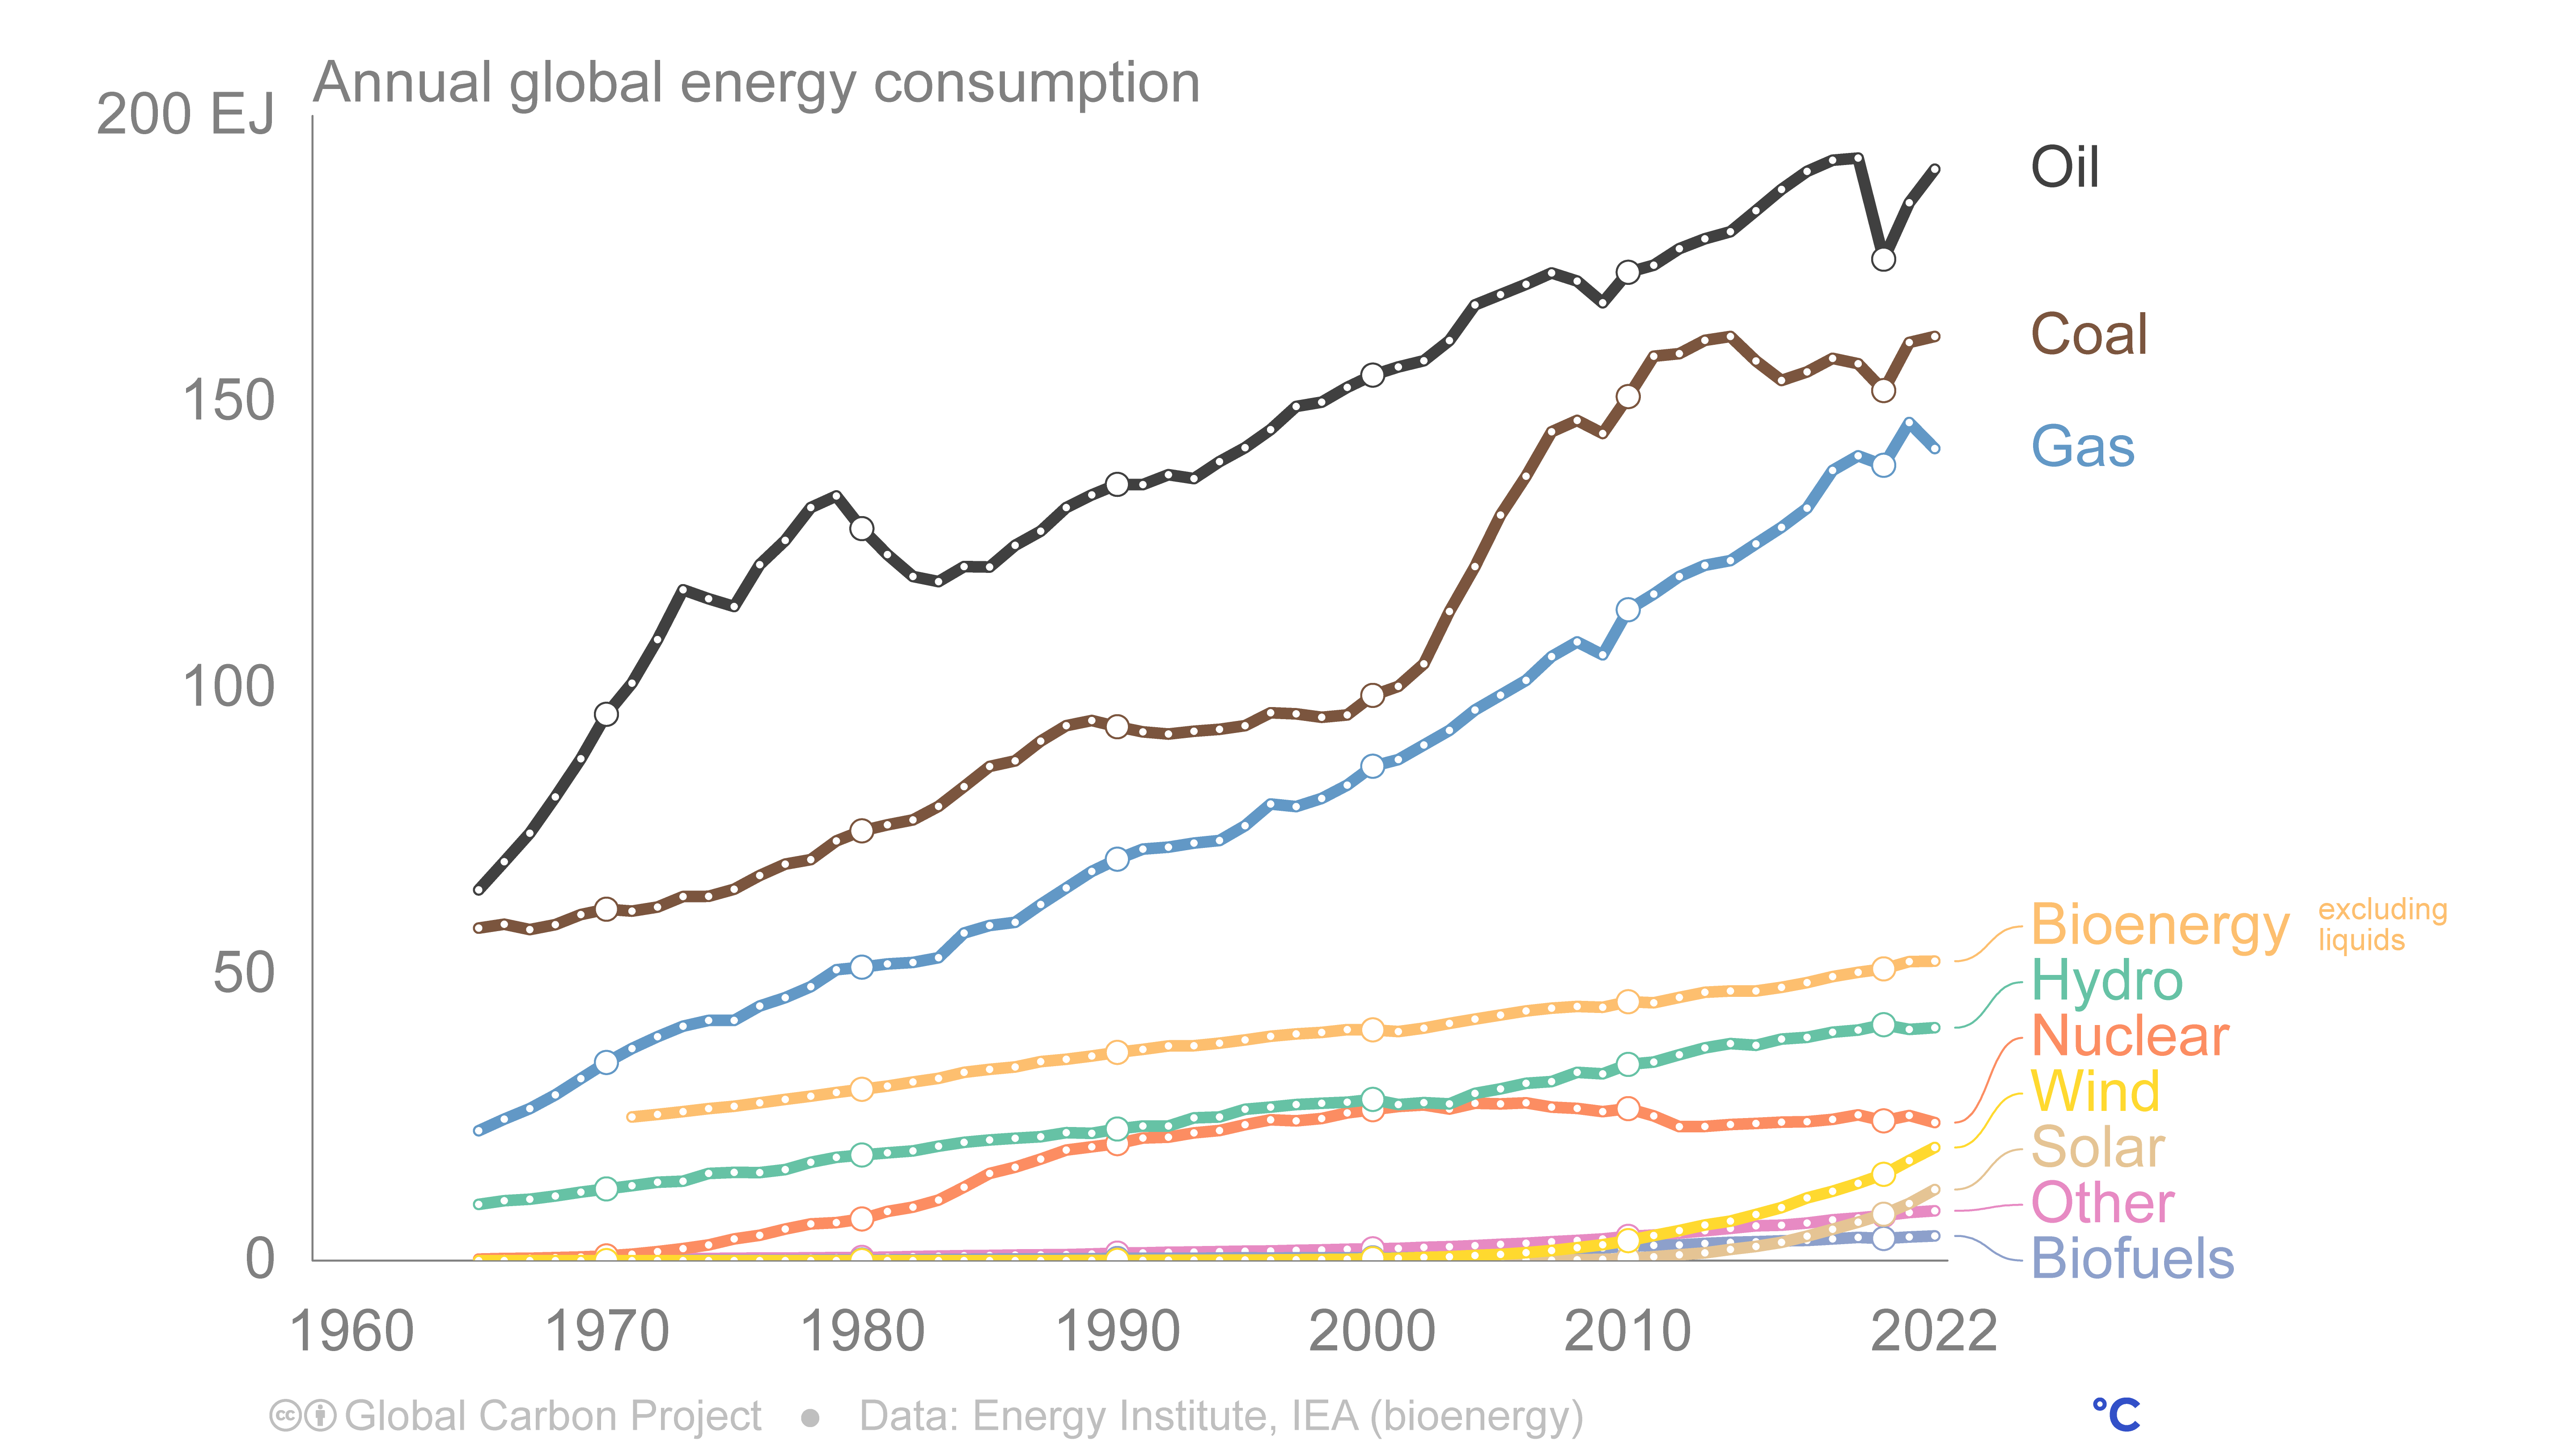
Annual global energy consumption

Right click to download: CSV / PNG
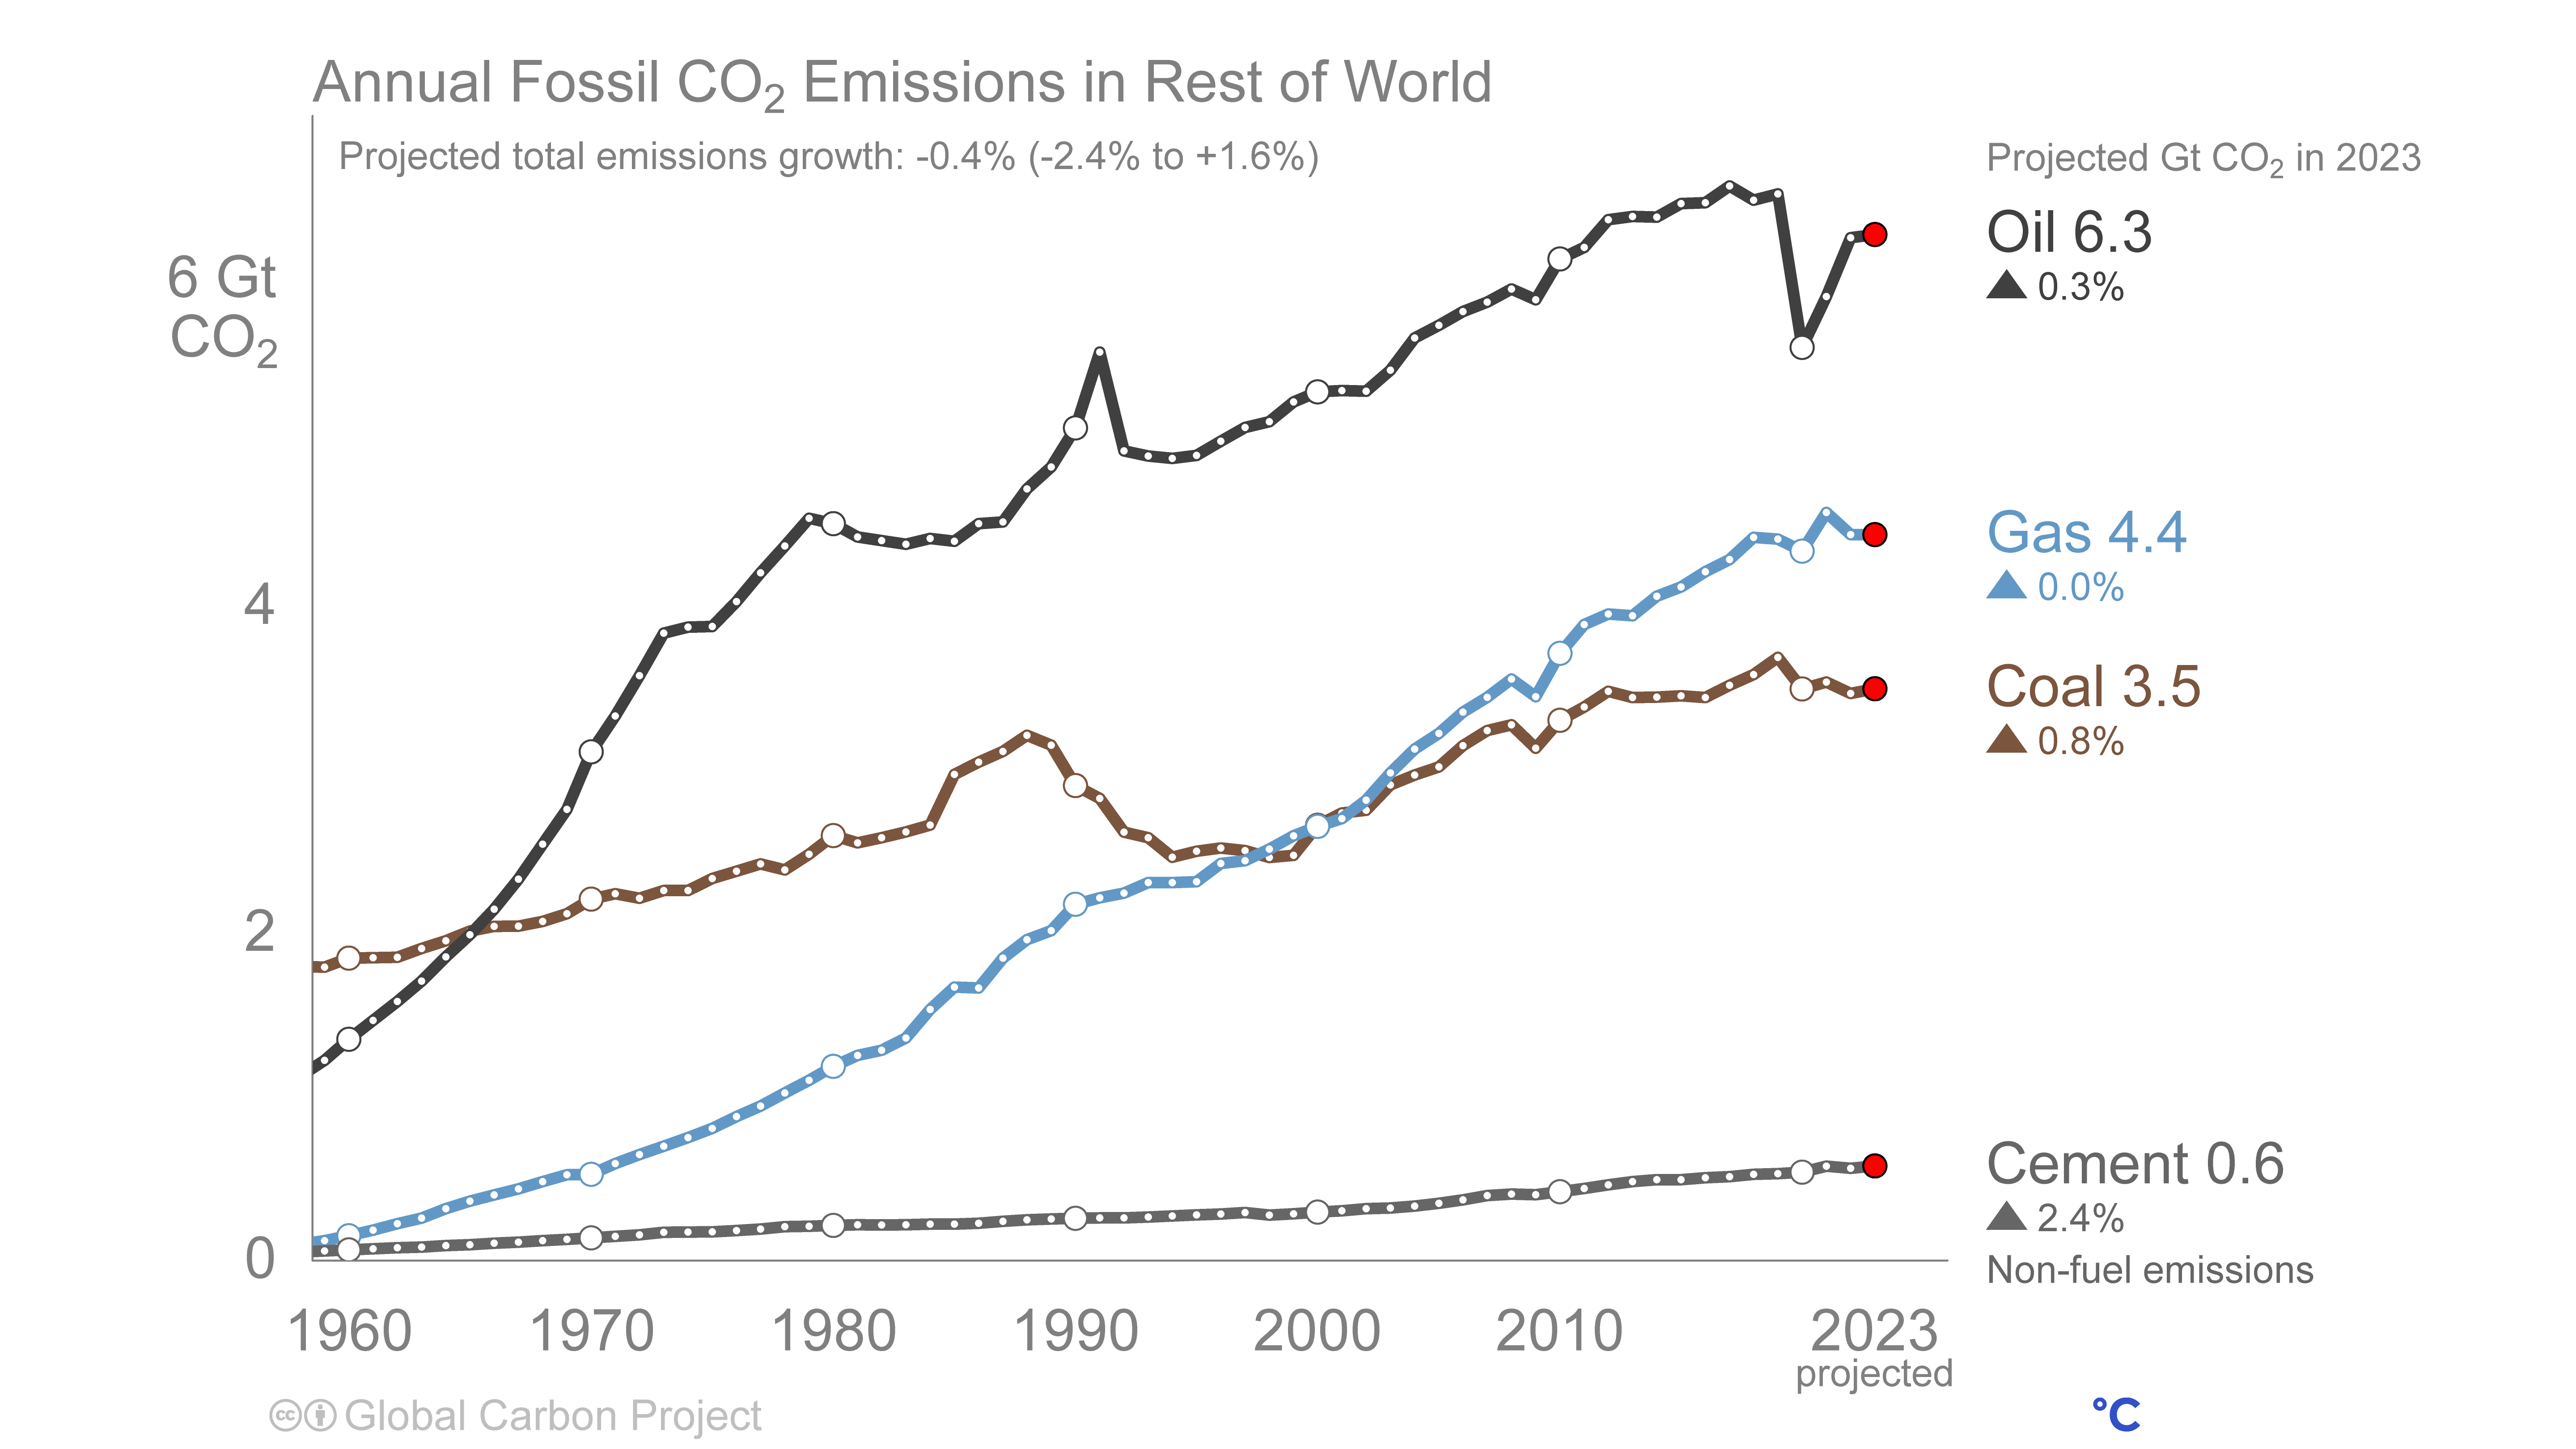
Annual Fossil co₂ Emissions in Rest of World

Right click to download: CSV / PNG
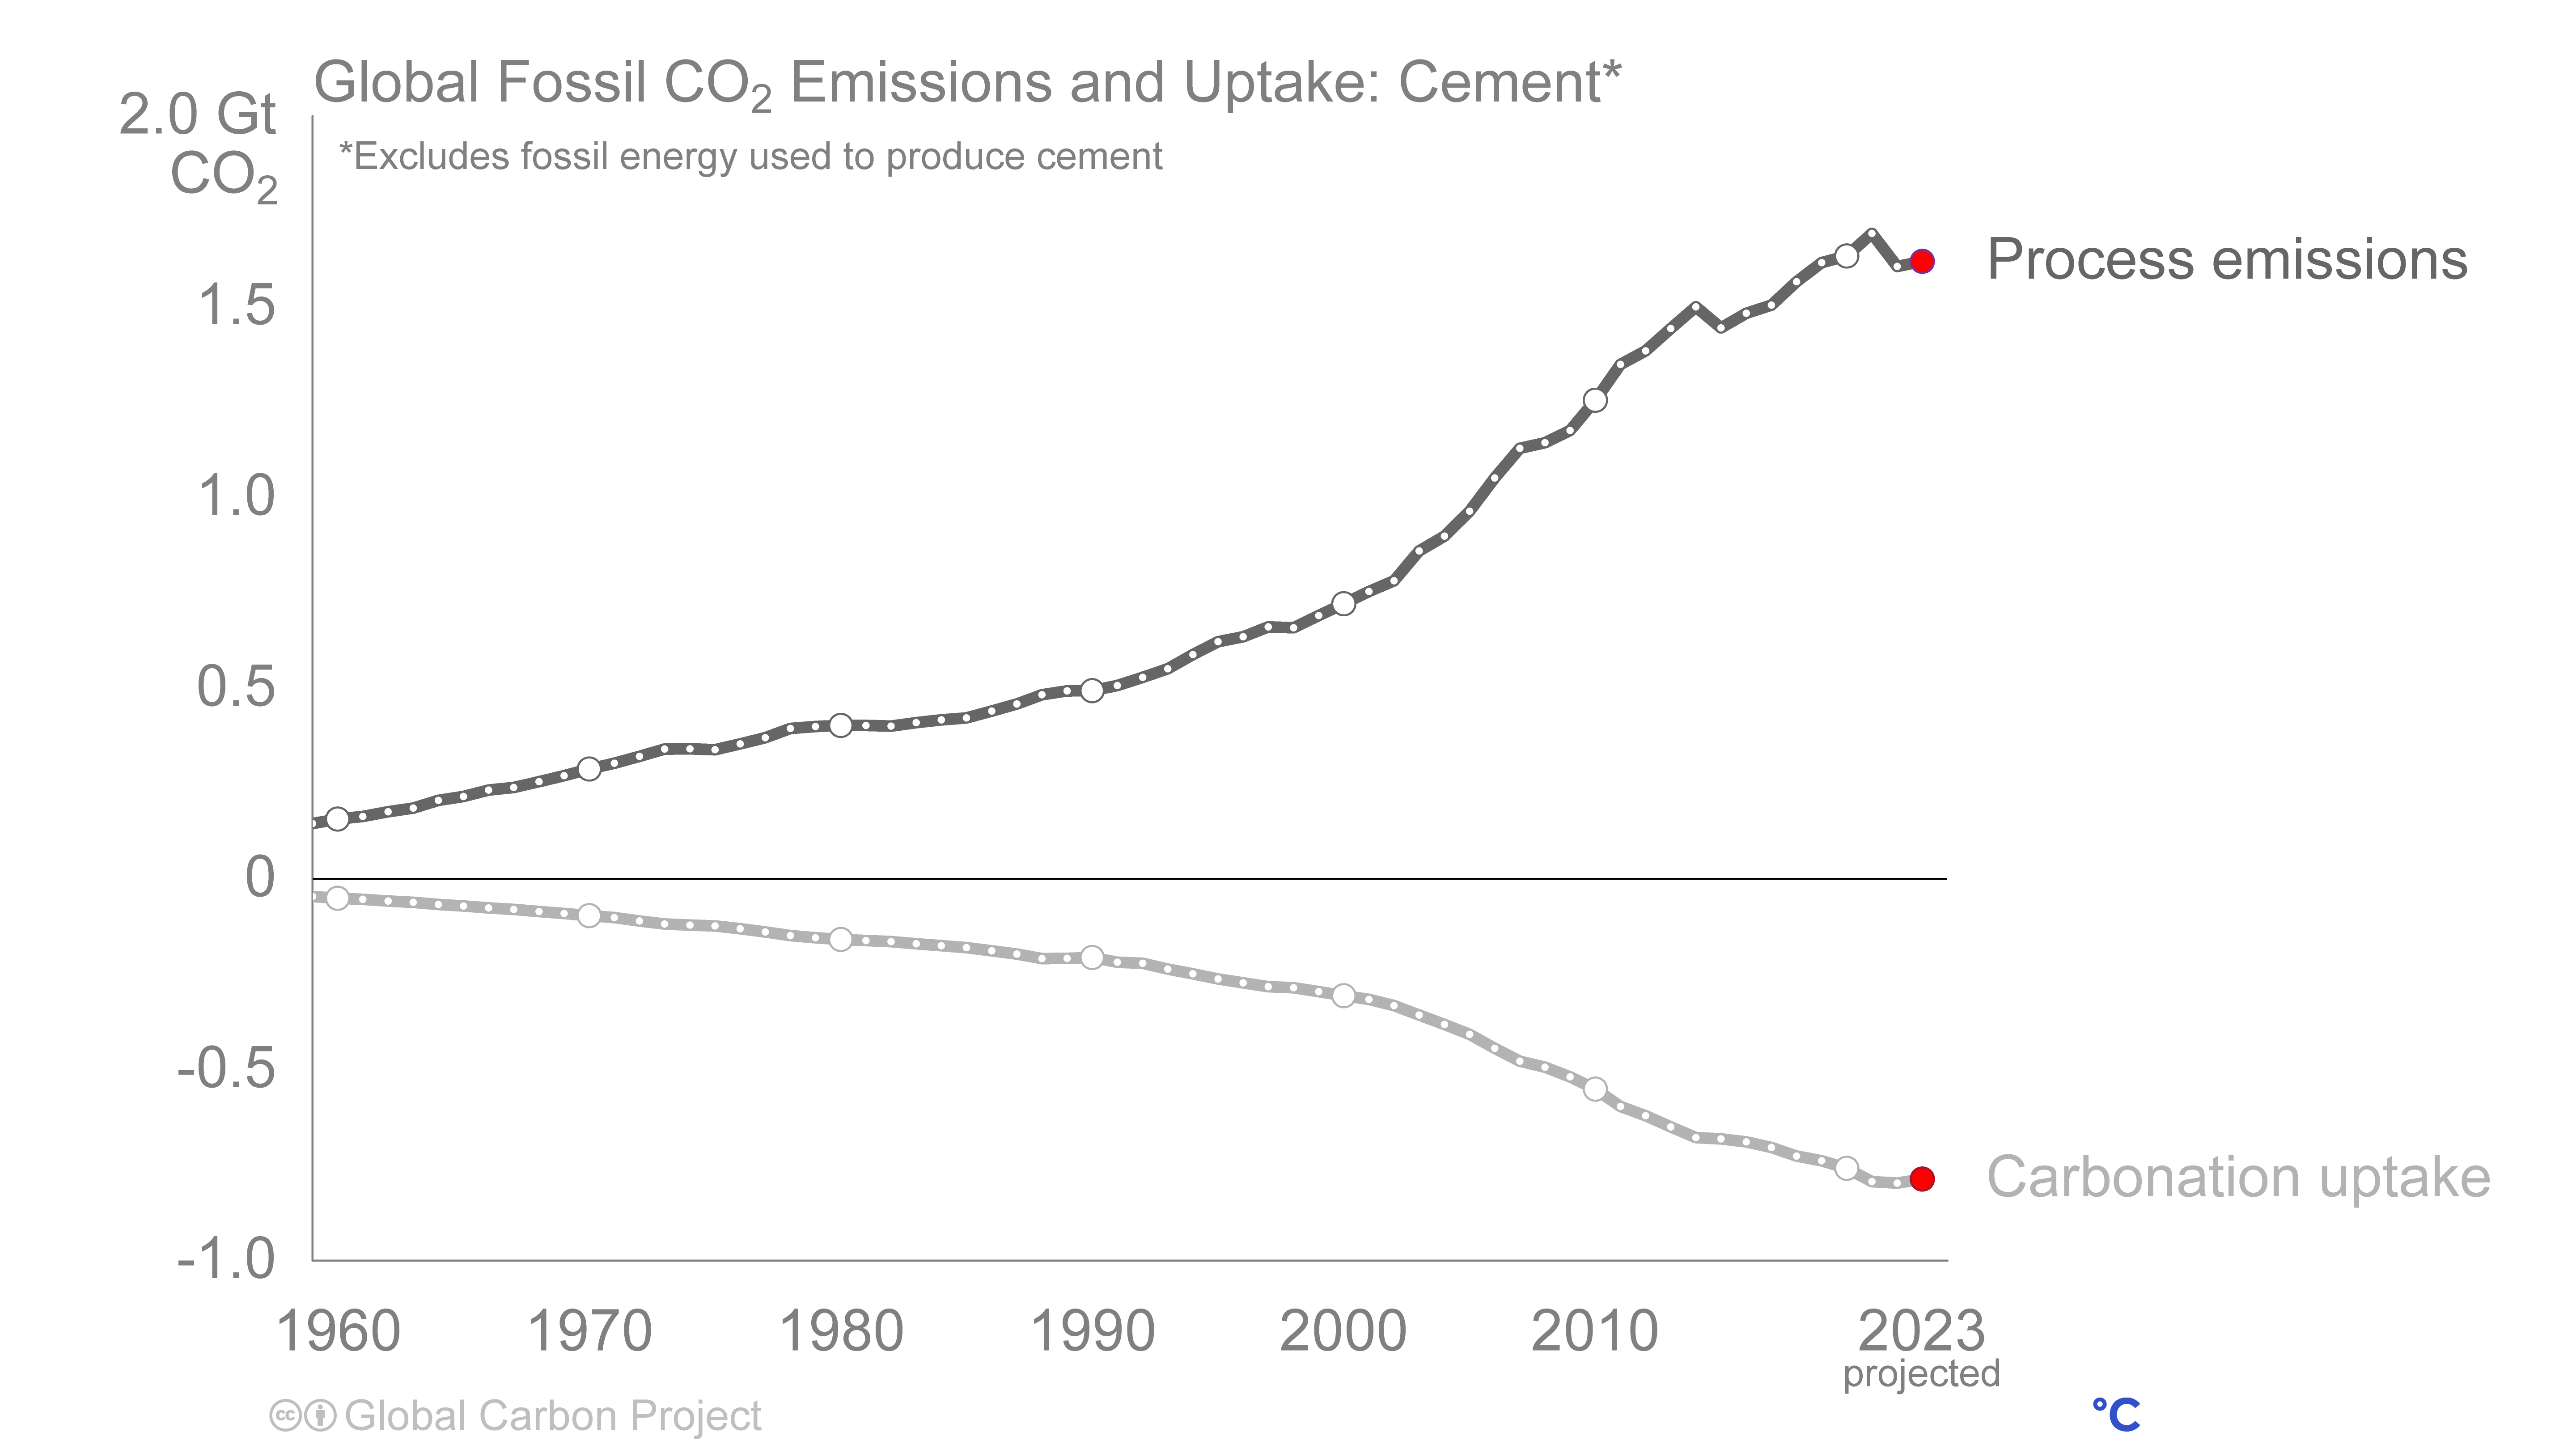
Global Fossil co₂ Emissions and Uptake: Cement*

Right click to download: CSV / PNG
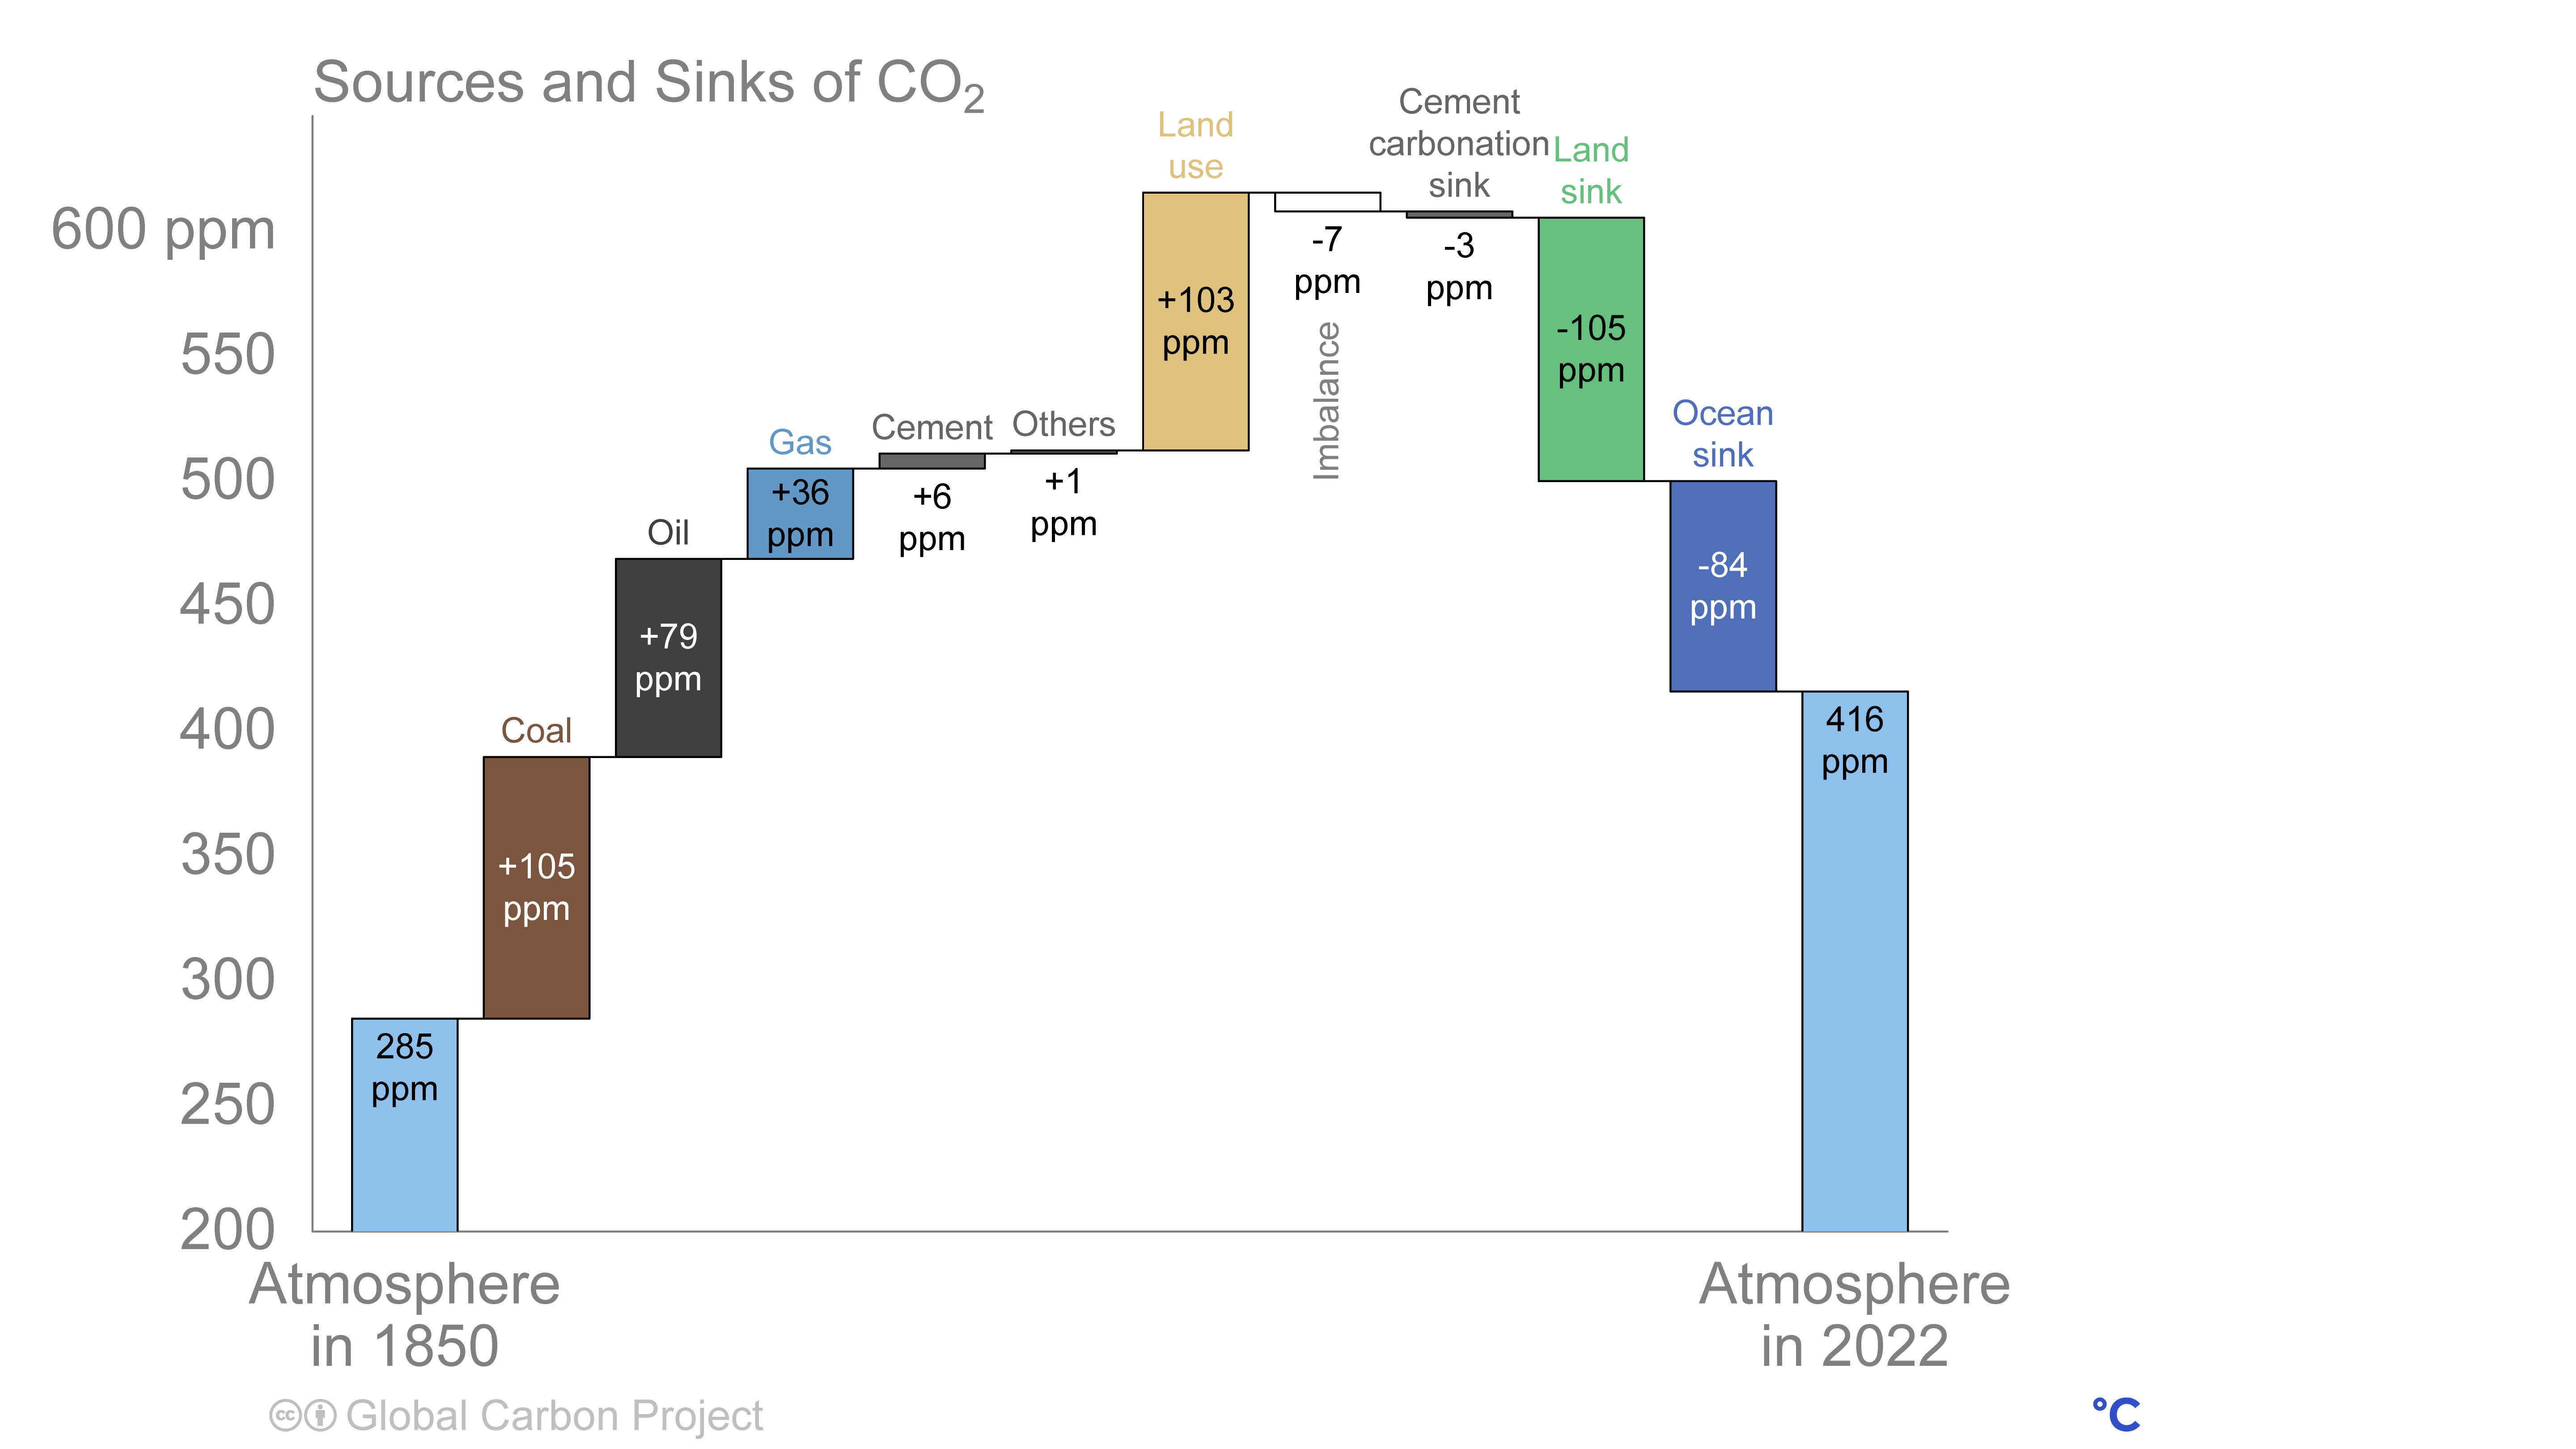
Sources and Sinks of co₂

Right click to download: PNG
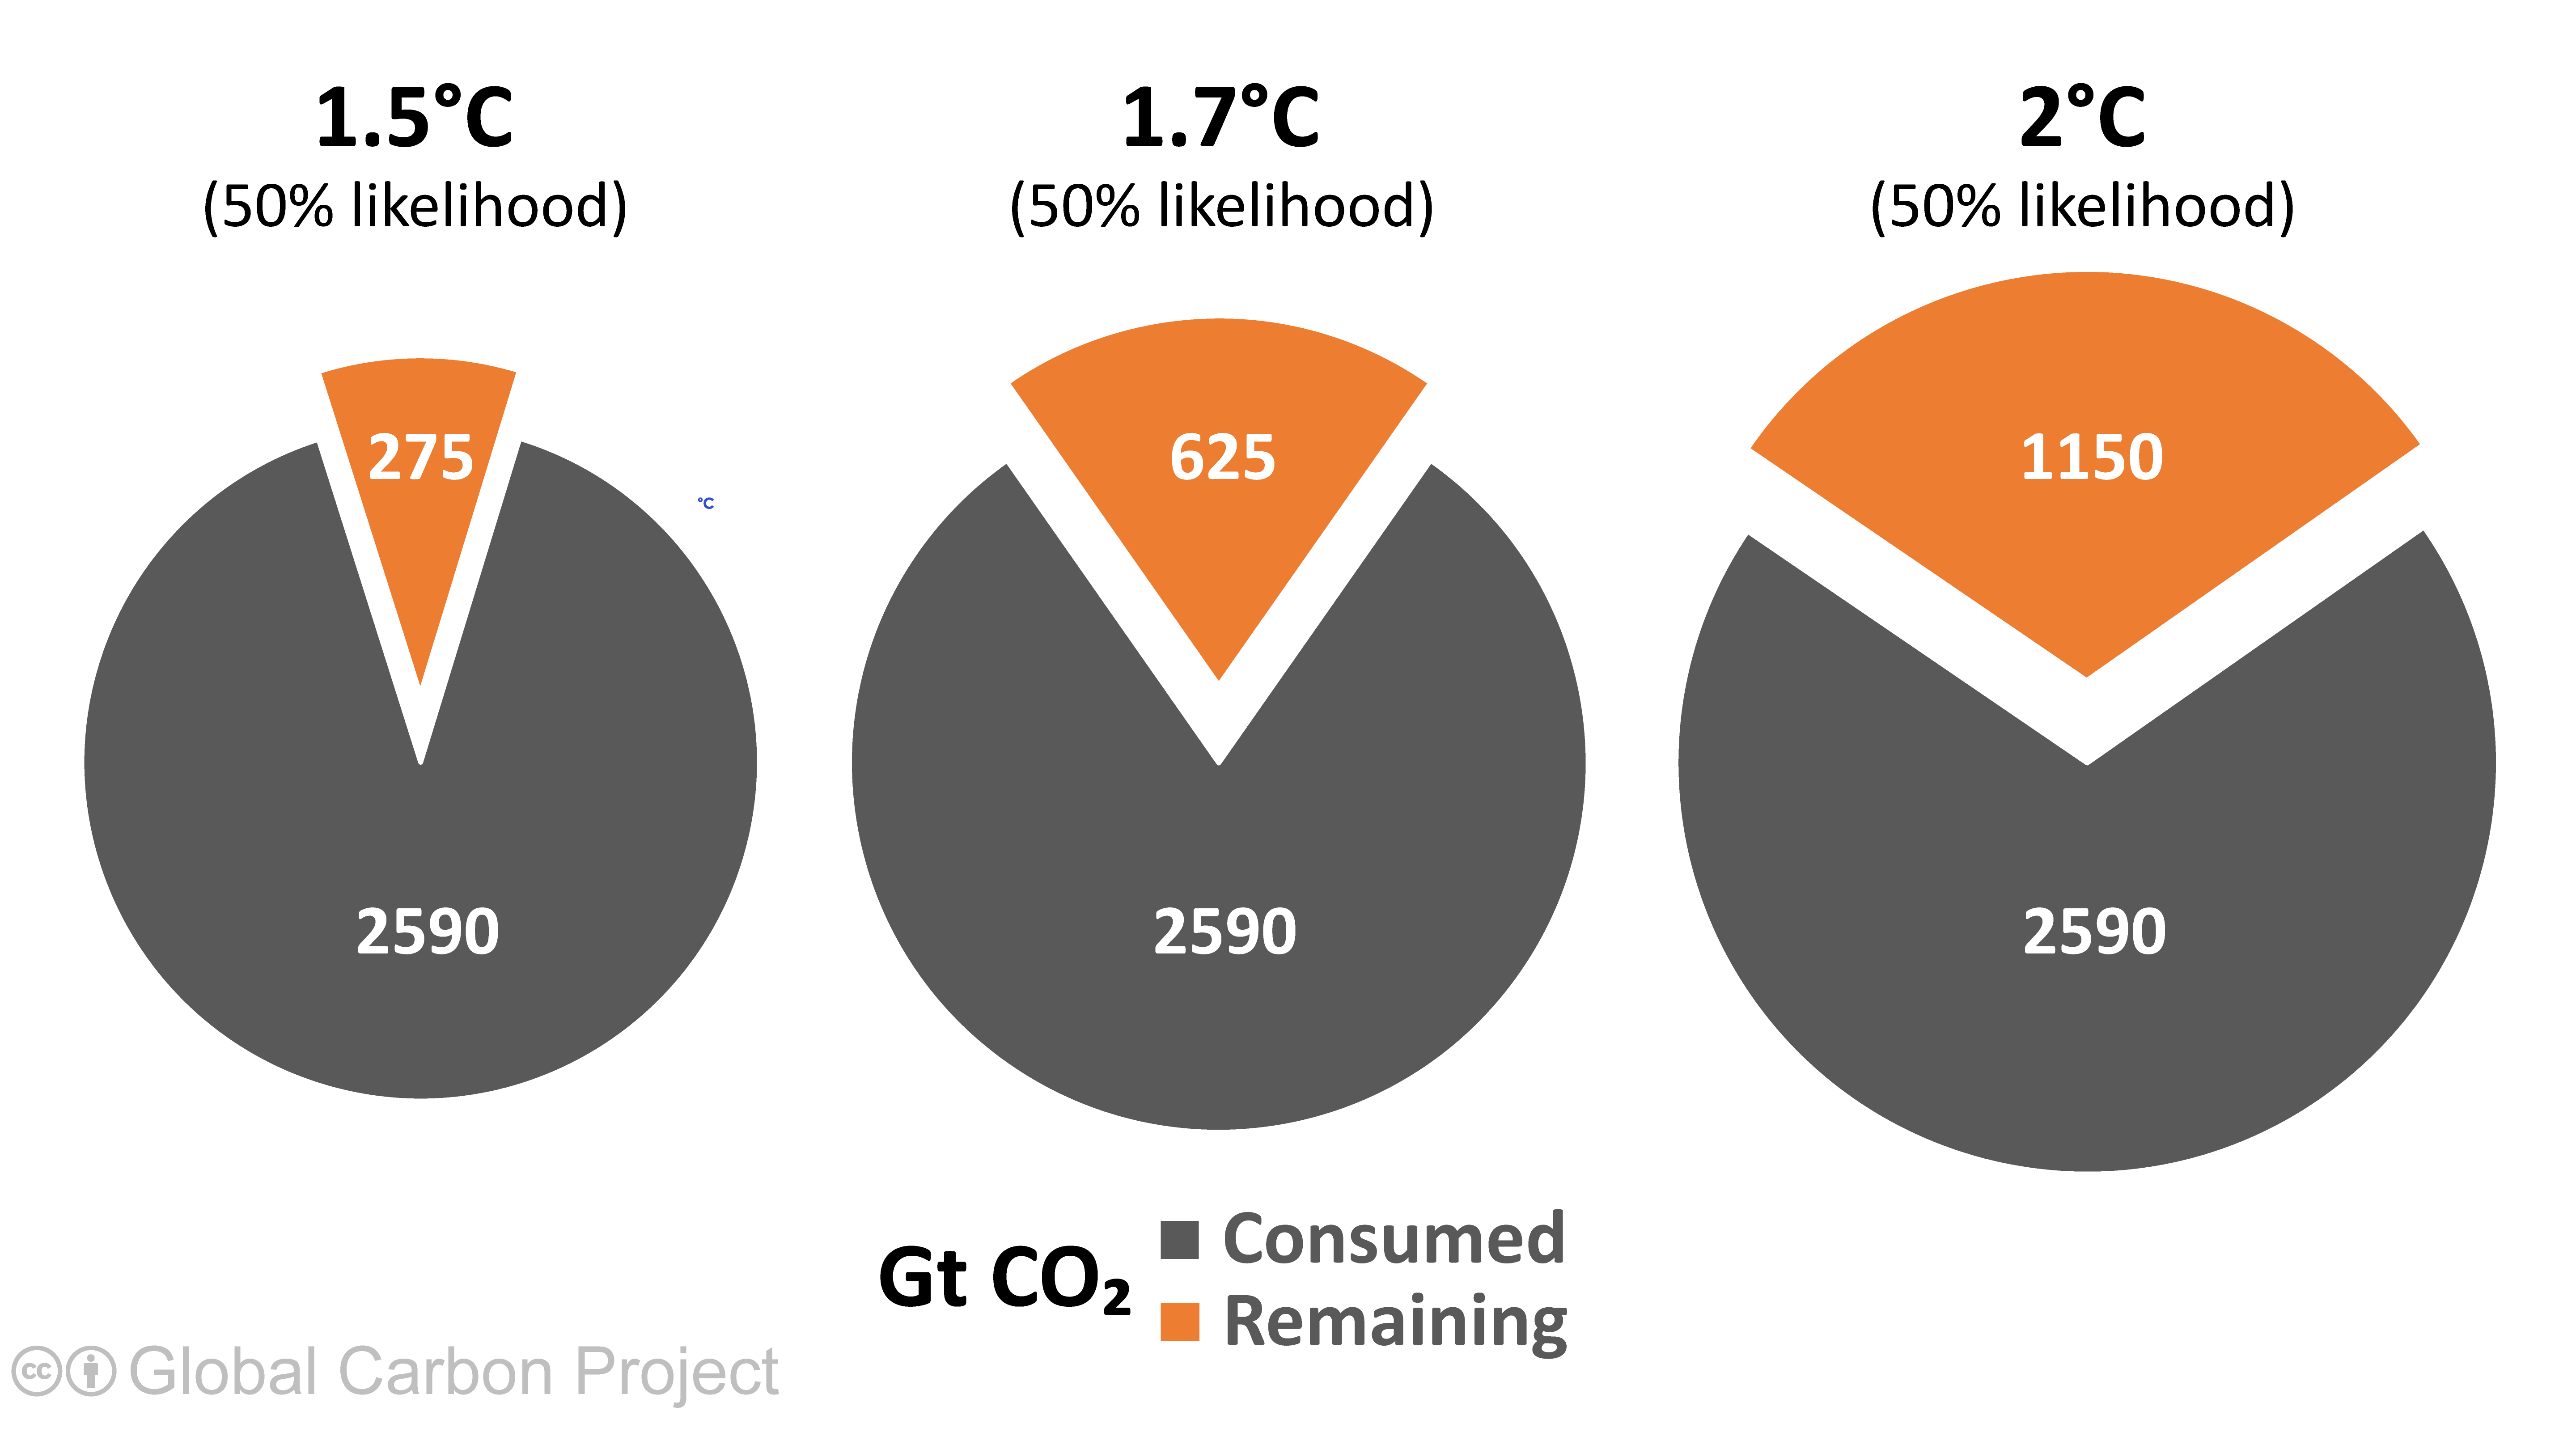
Remaining carbon budget

Right click to download: PNG
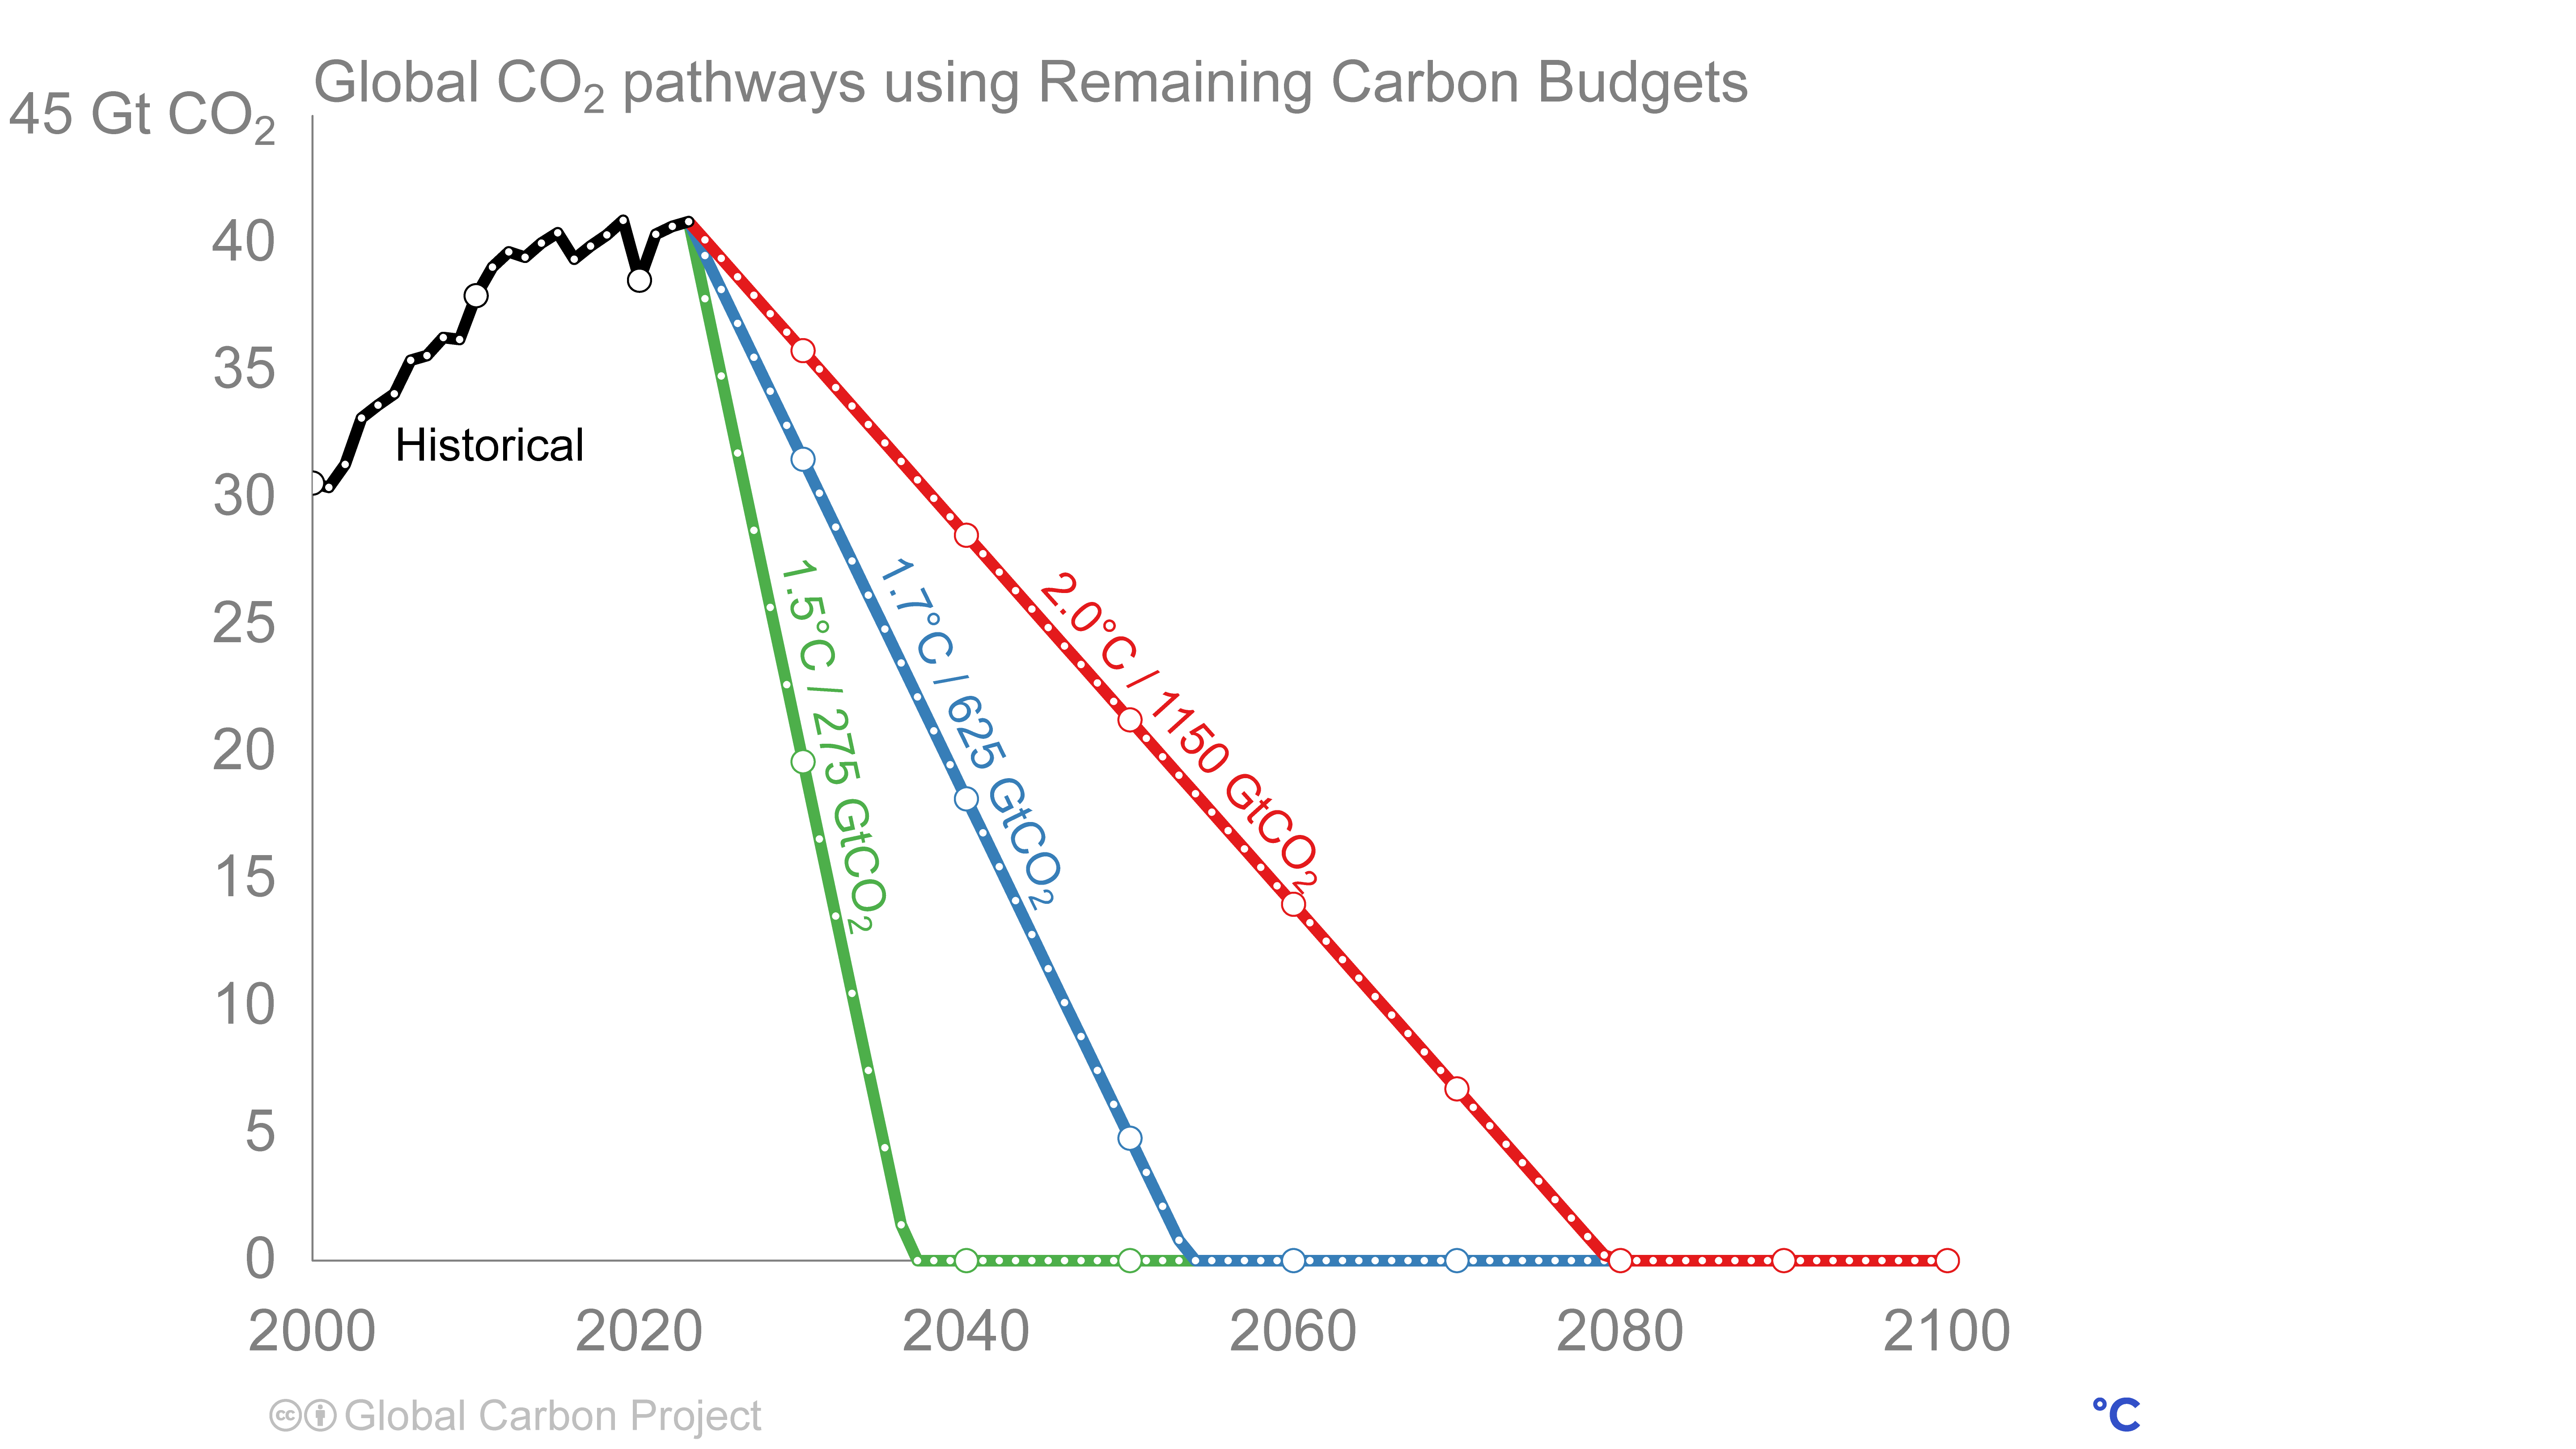
Global co₂ pathways using Remaining Carbon Budgets

Right click to download: CSV / PNG
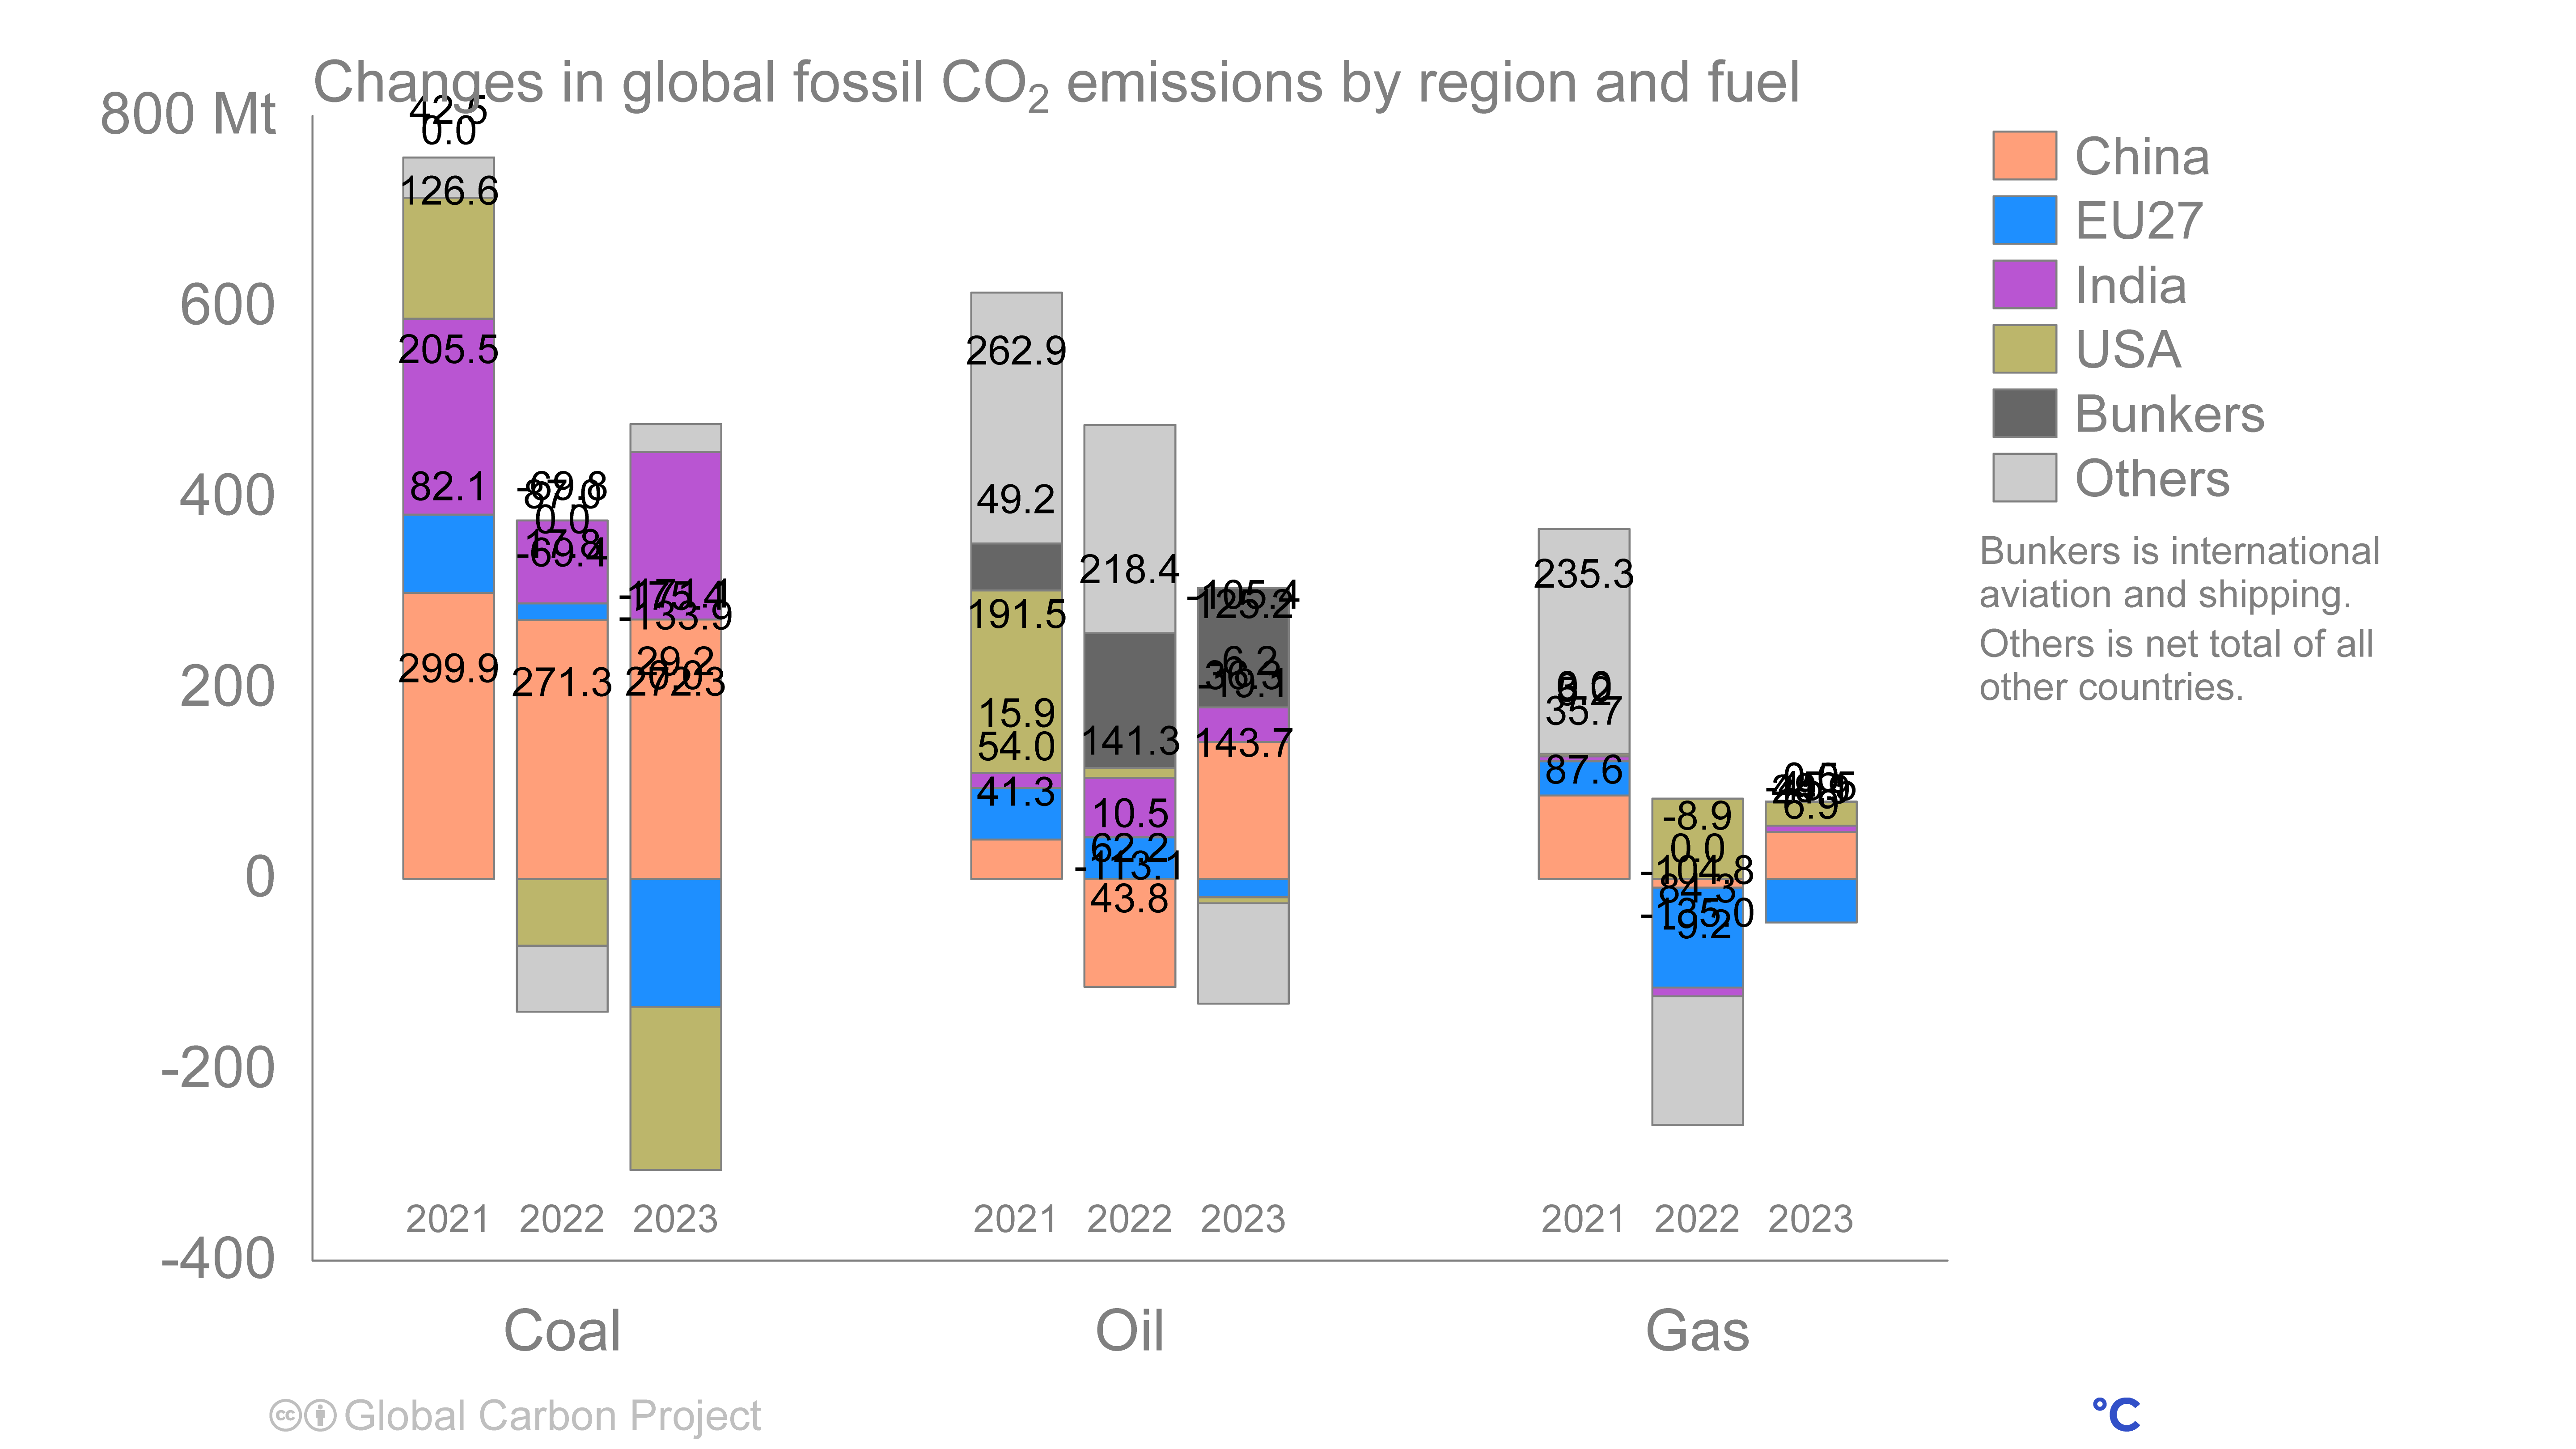
Changes in global fossil co₂ emissions by region and fuel

Right click to download: PNG
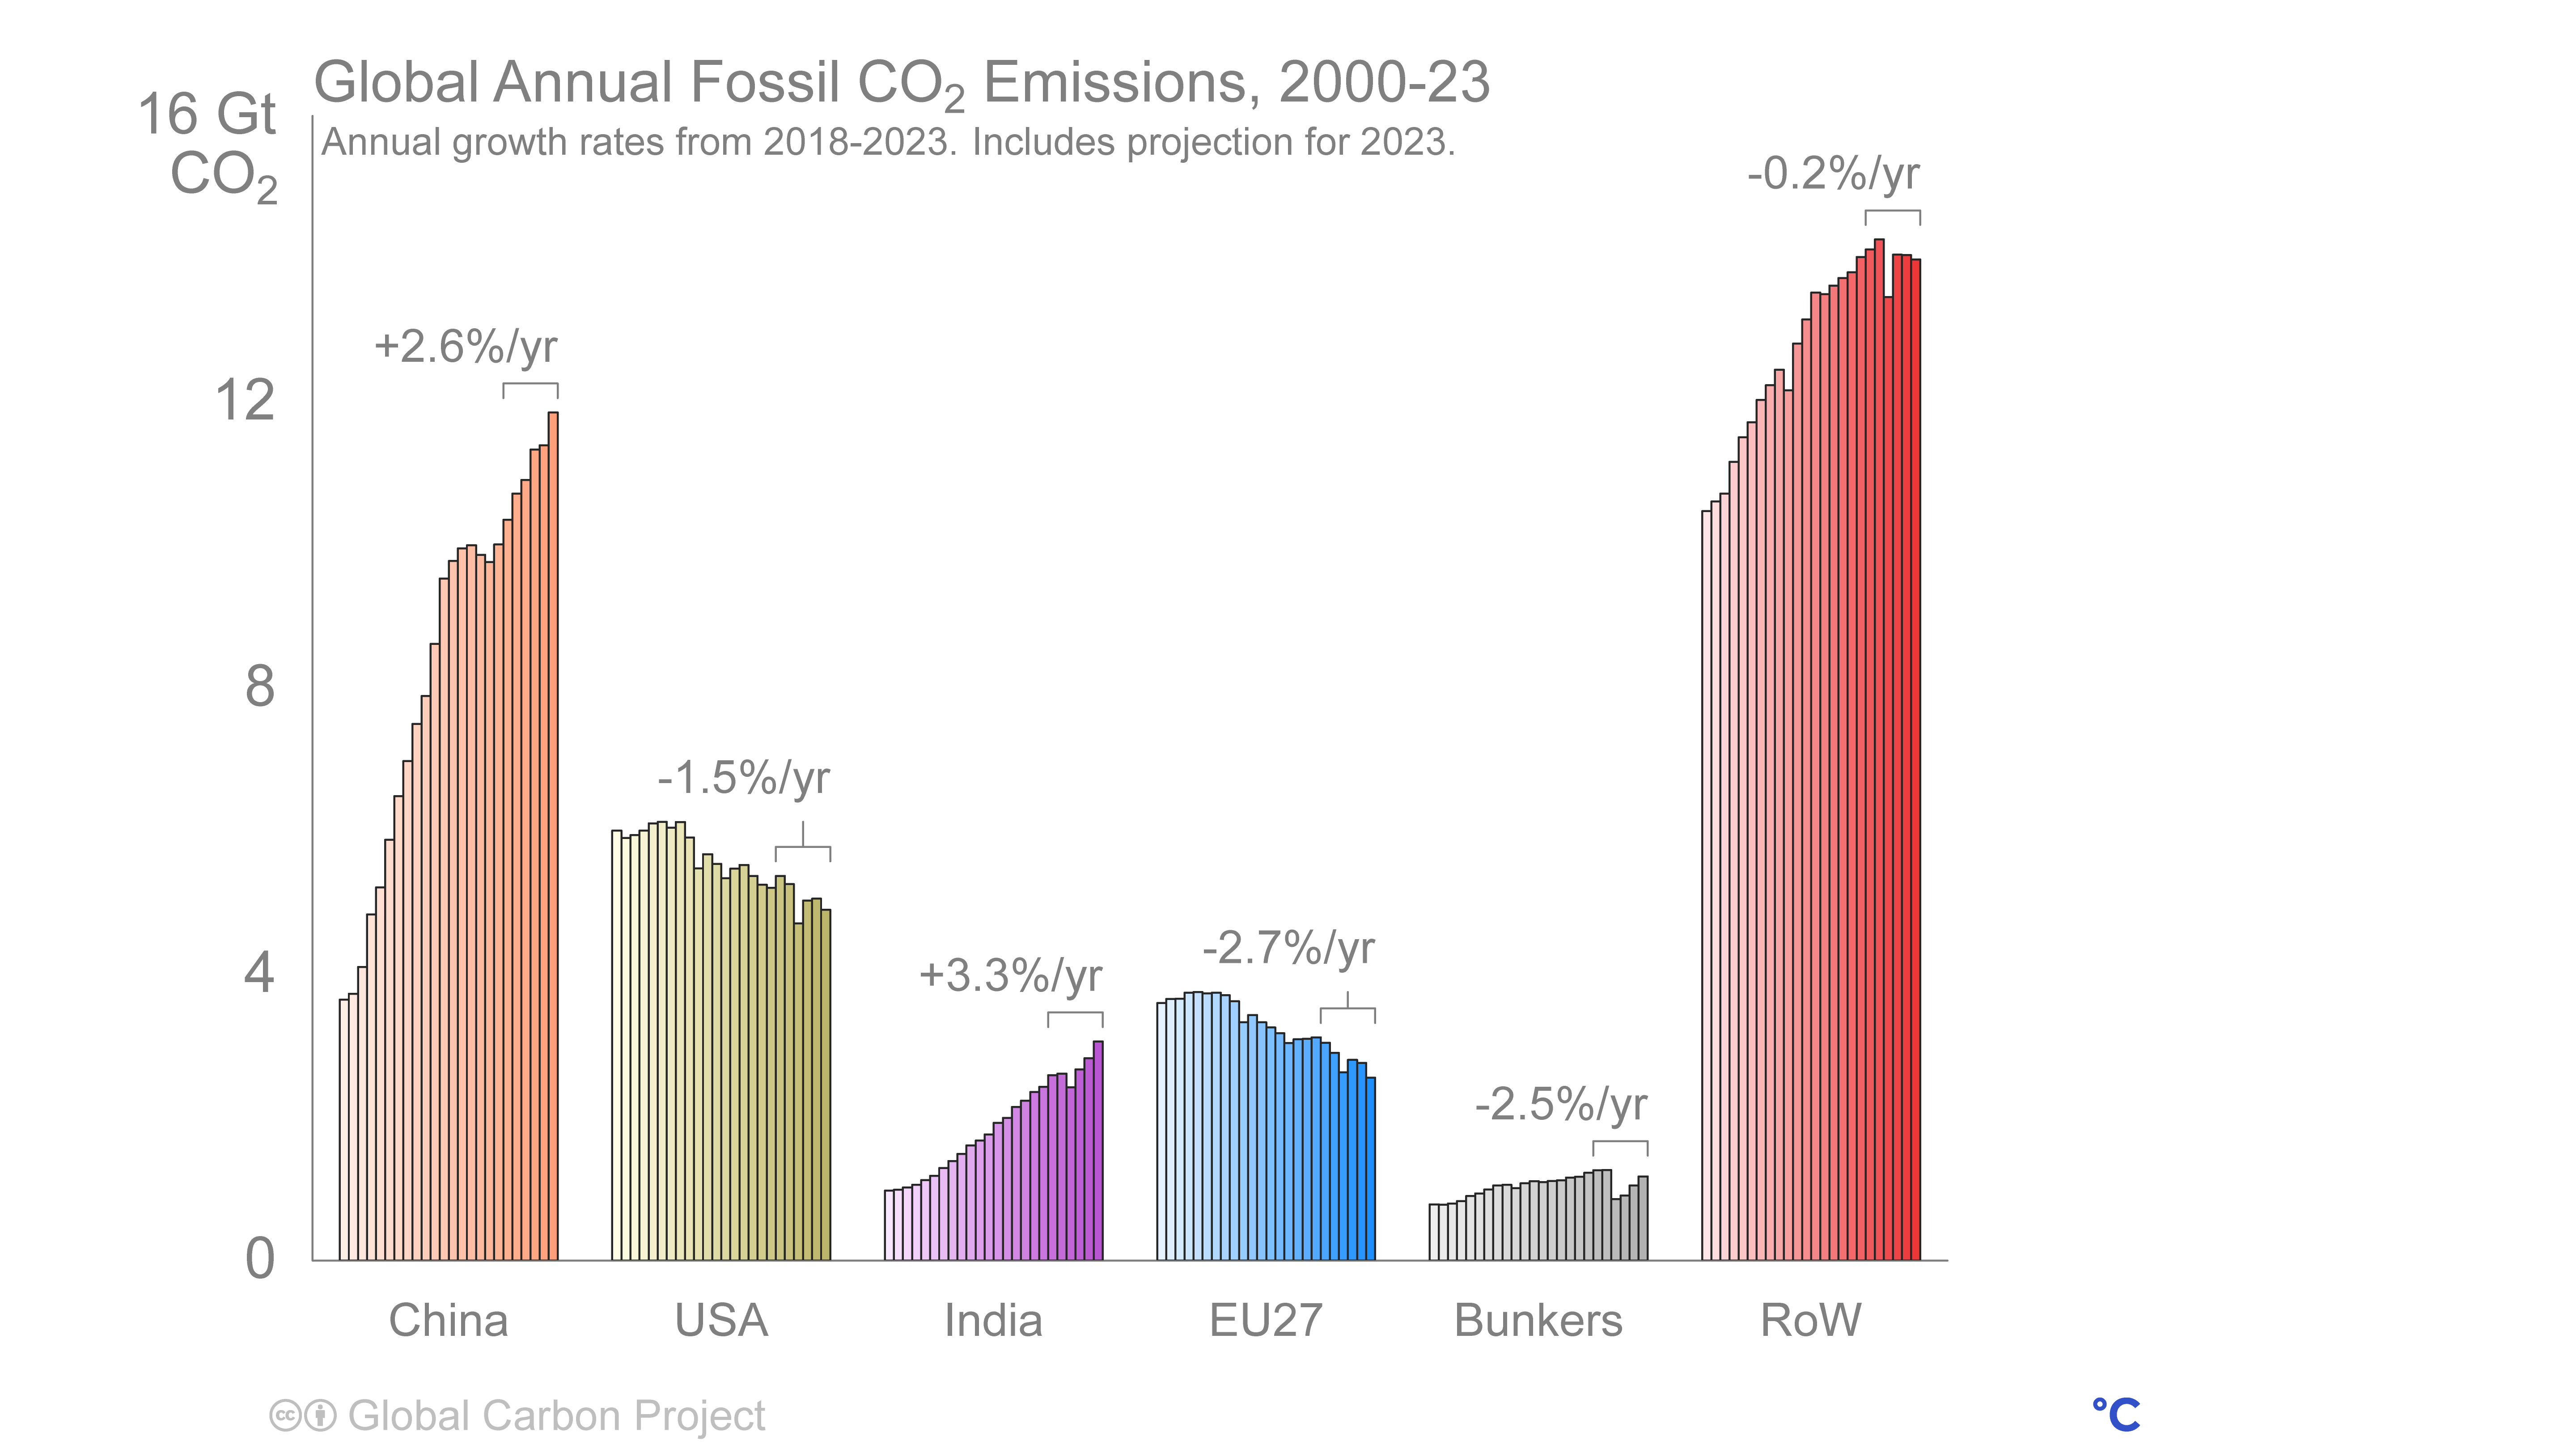
Global Annual Fossil co₂ Emissions, 2000-23

Right click to download: CSV / PNG
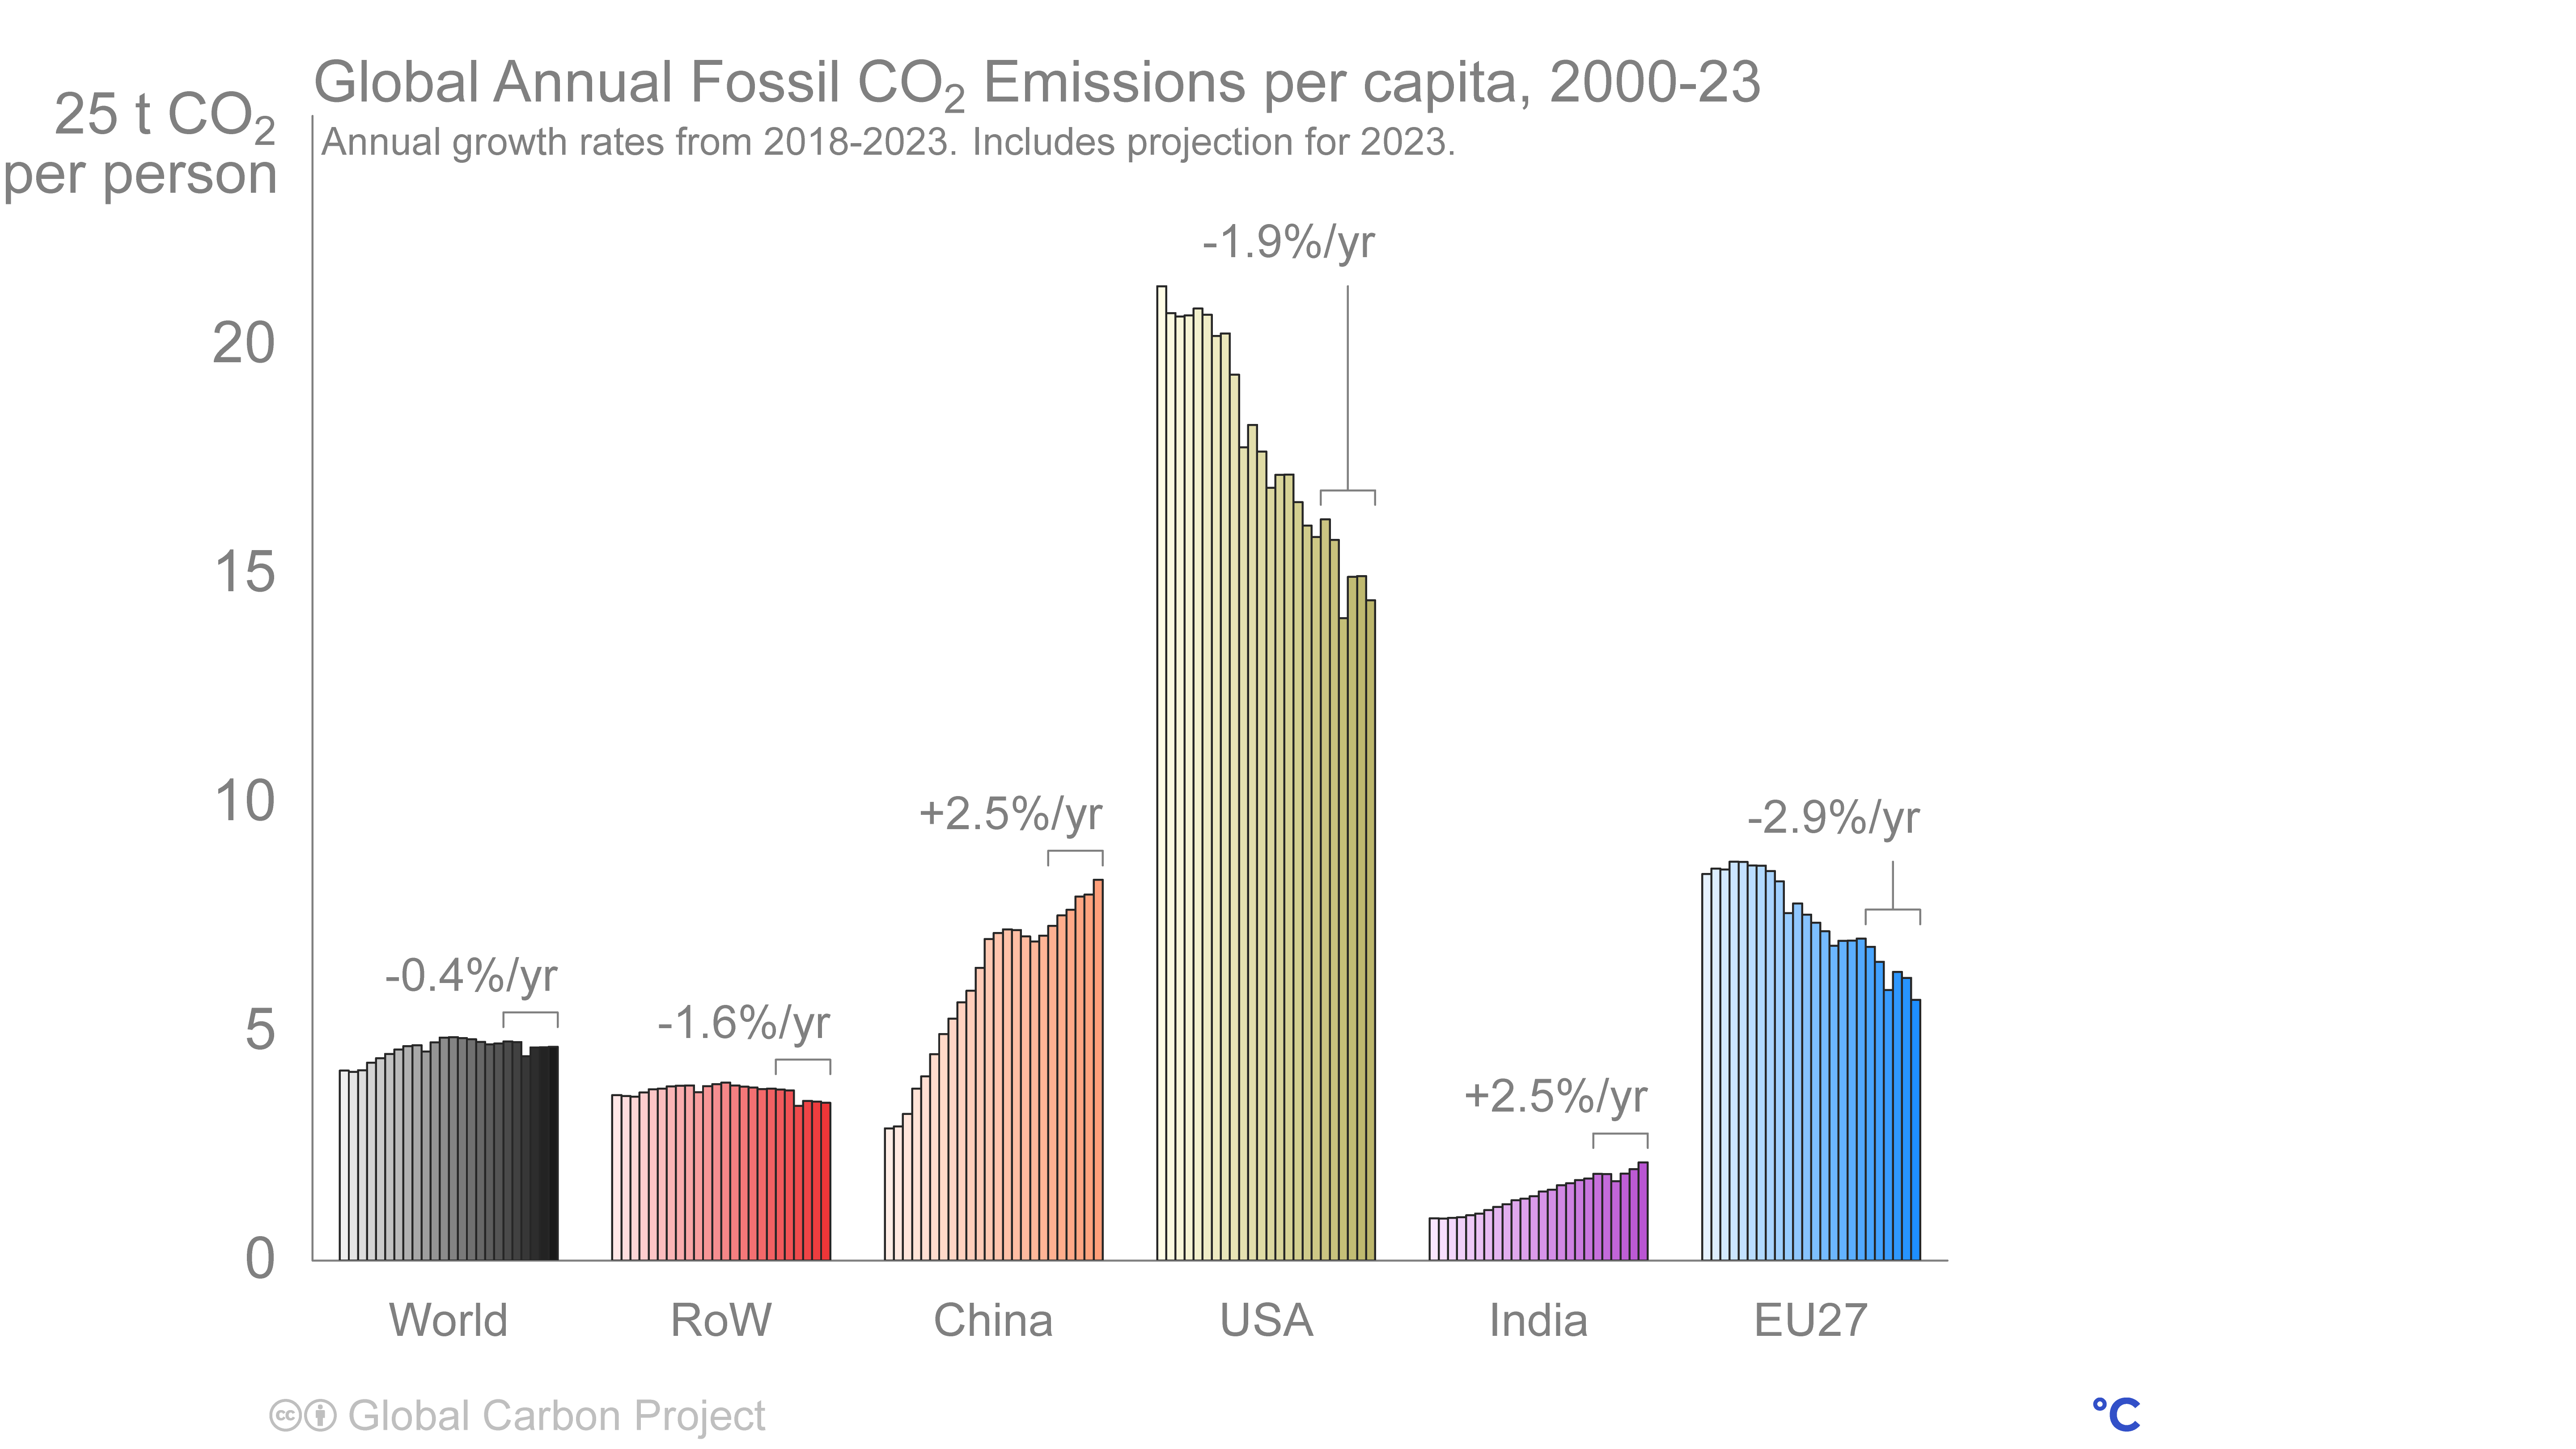
Global Annual Fossil co₂ Emissions per capita, 2000-23

Right click to download: CSV / PNG
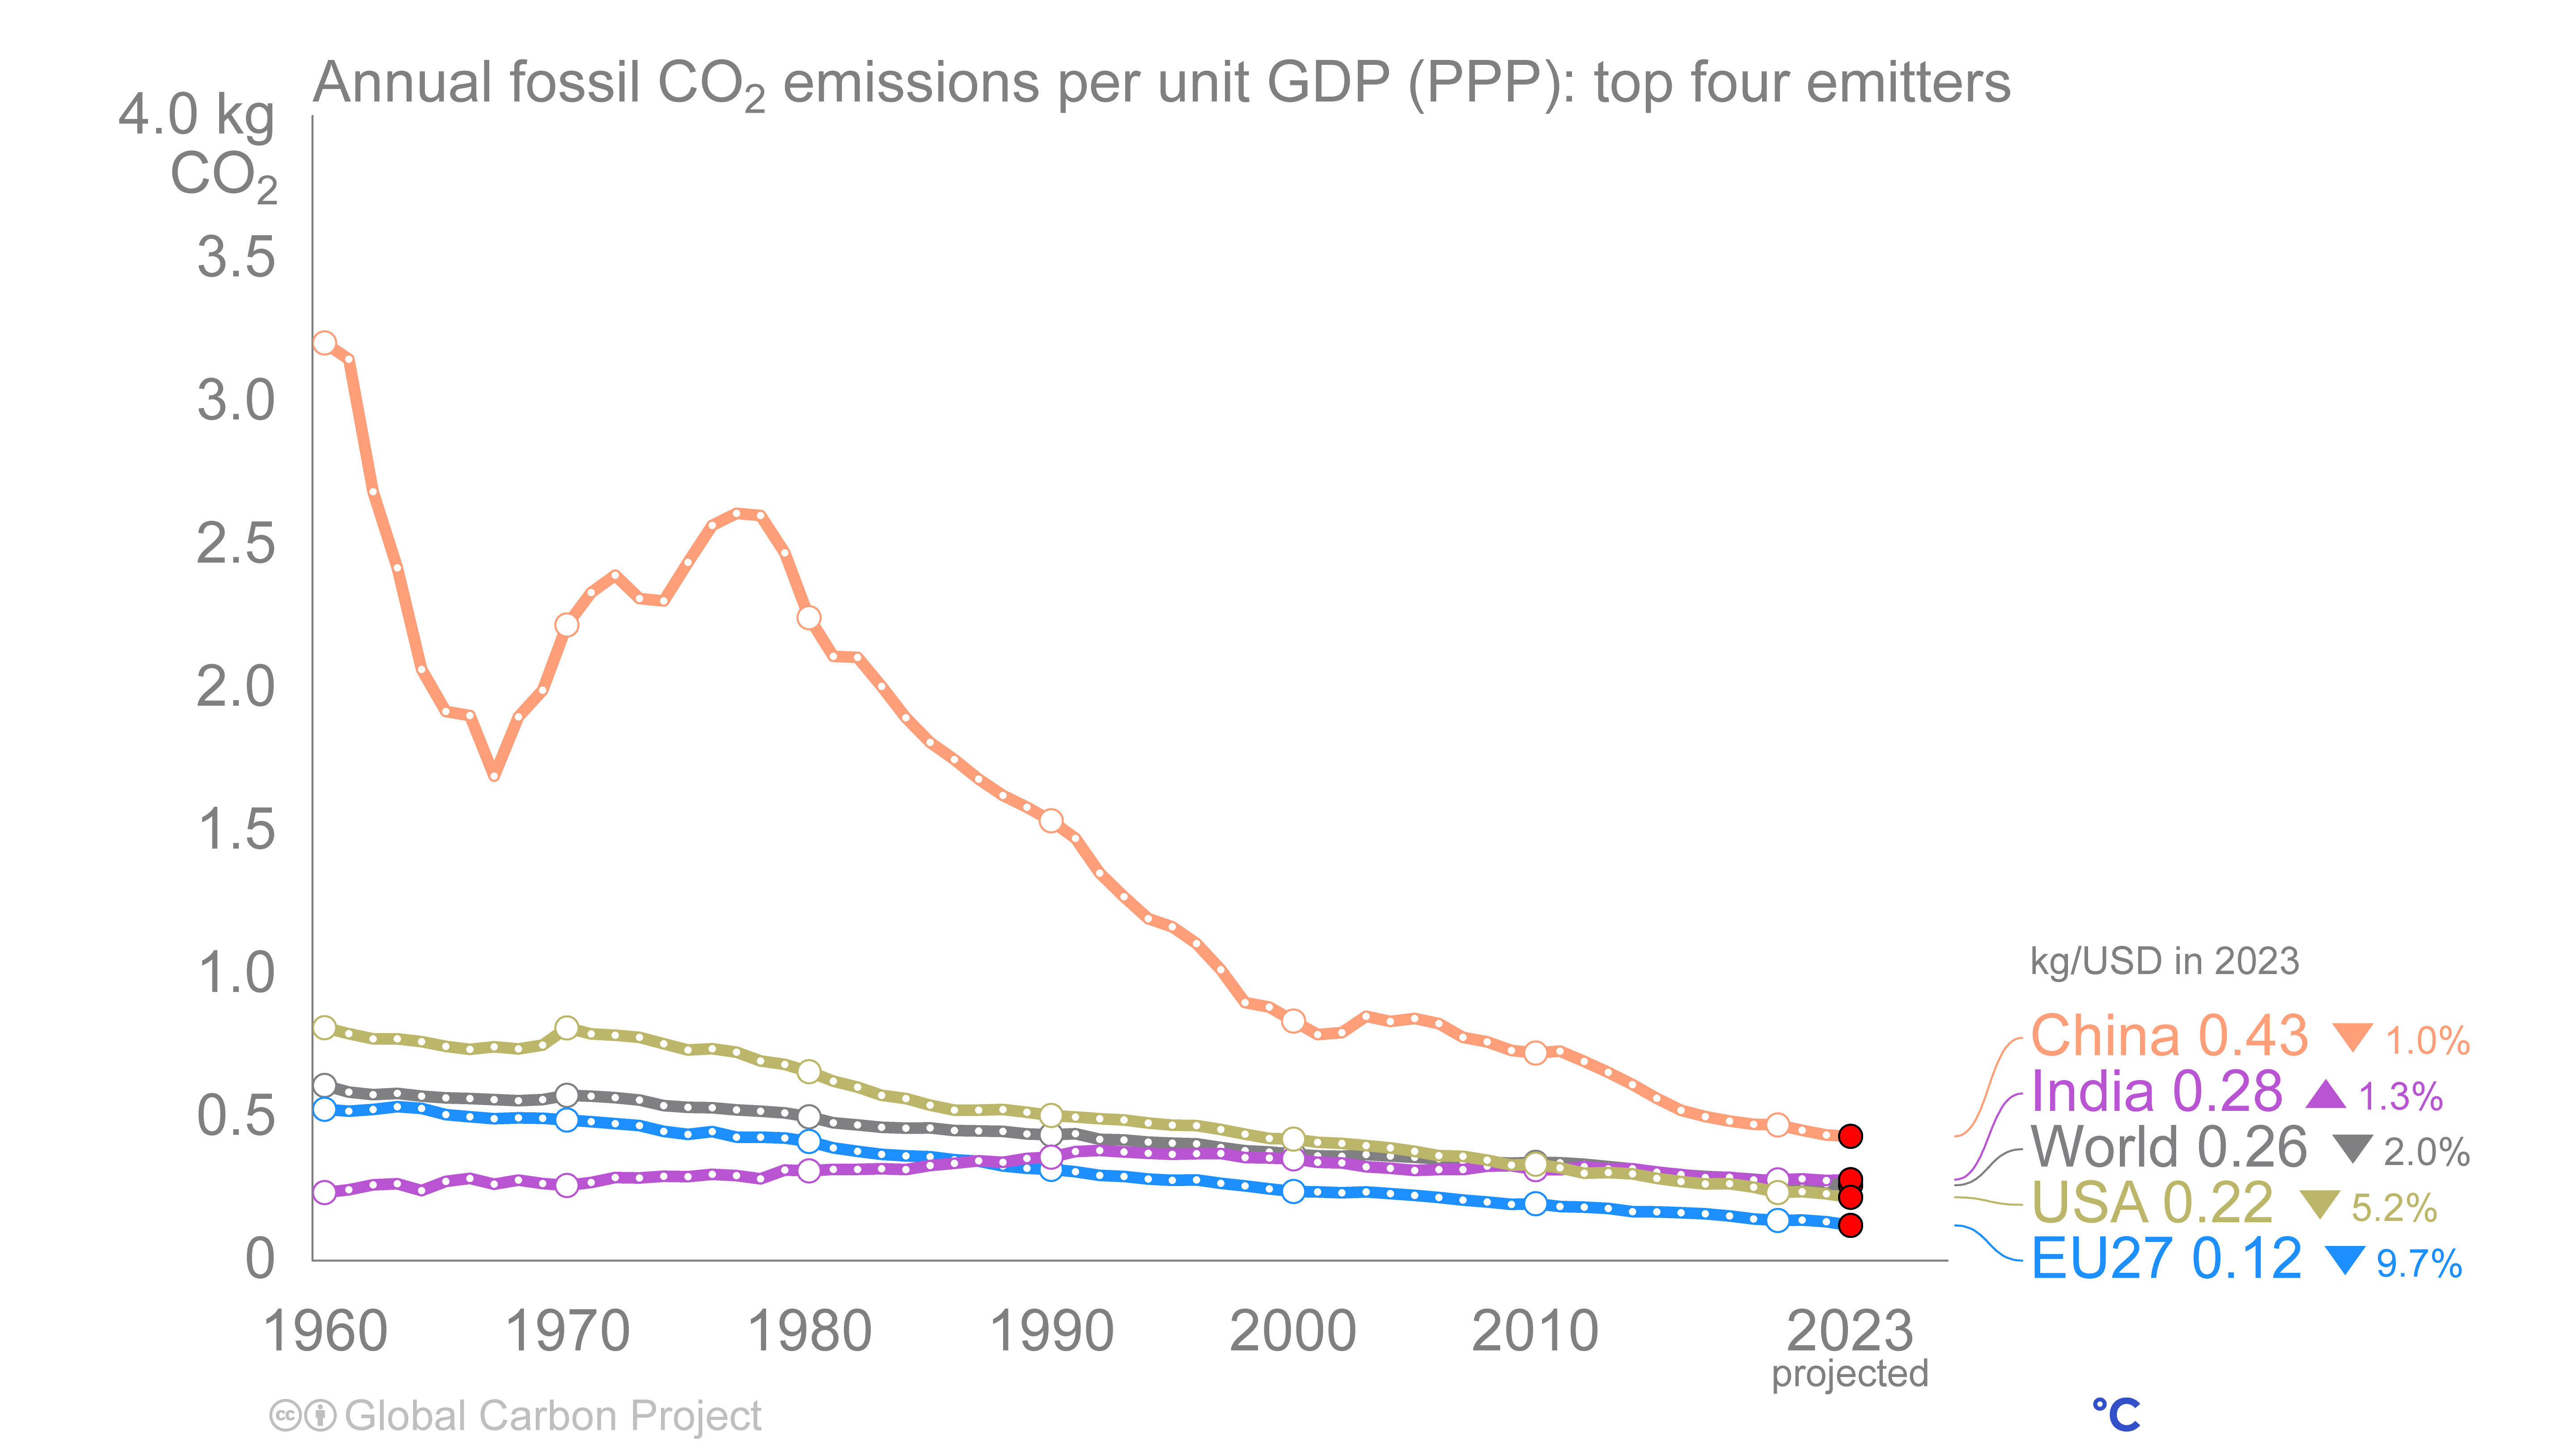
Annual fossil co₂ emissions per unit GDP (PPP): top four emitters

Right click to download: CSV / PNG
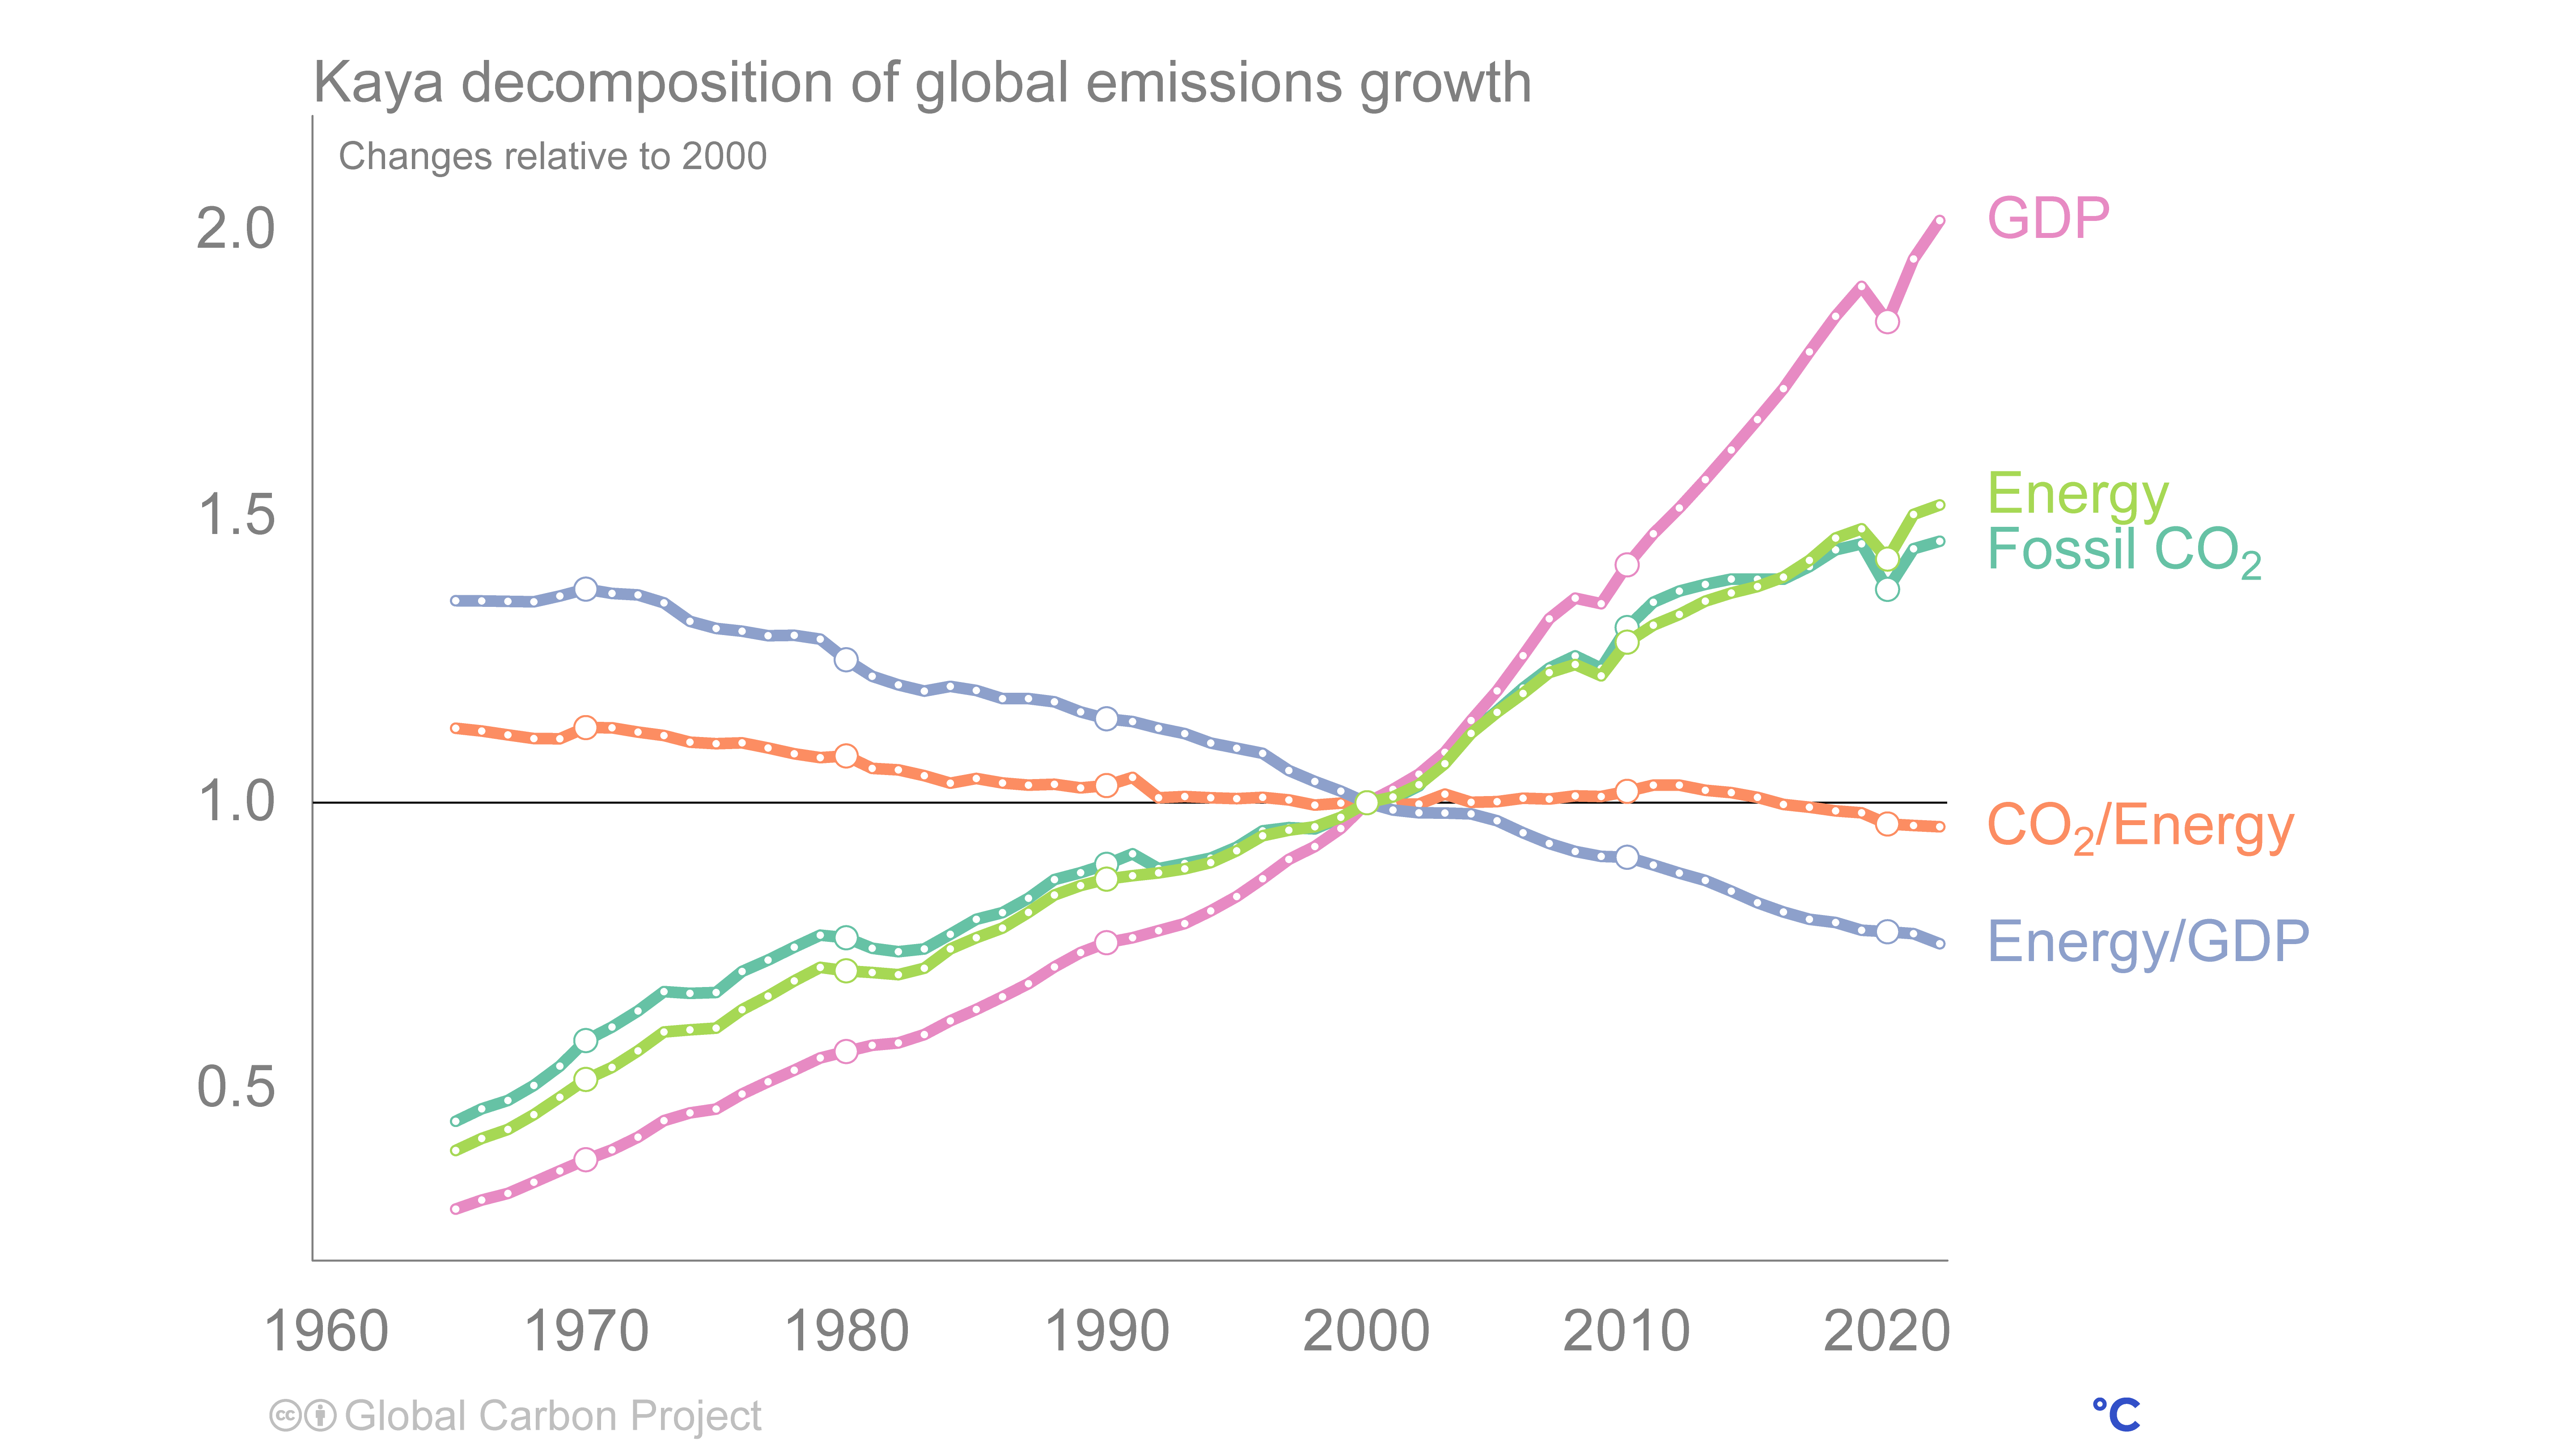
Kaya decomposition of global emissions growth

Right click to download: CSV / PNG
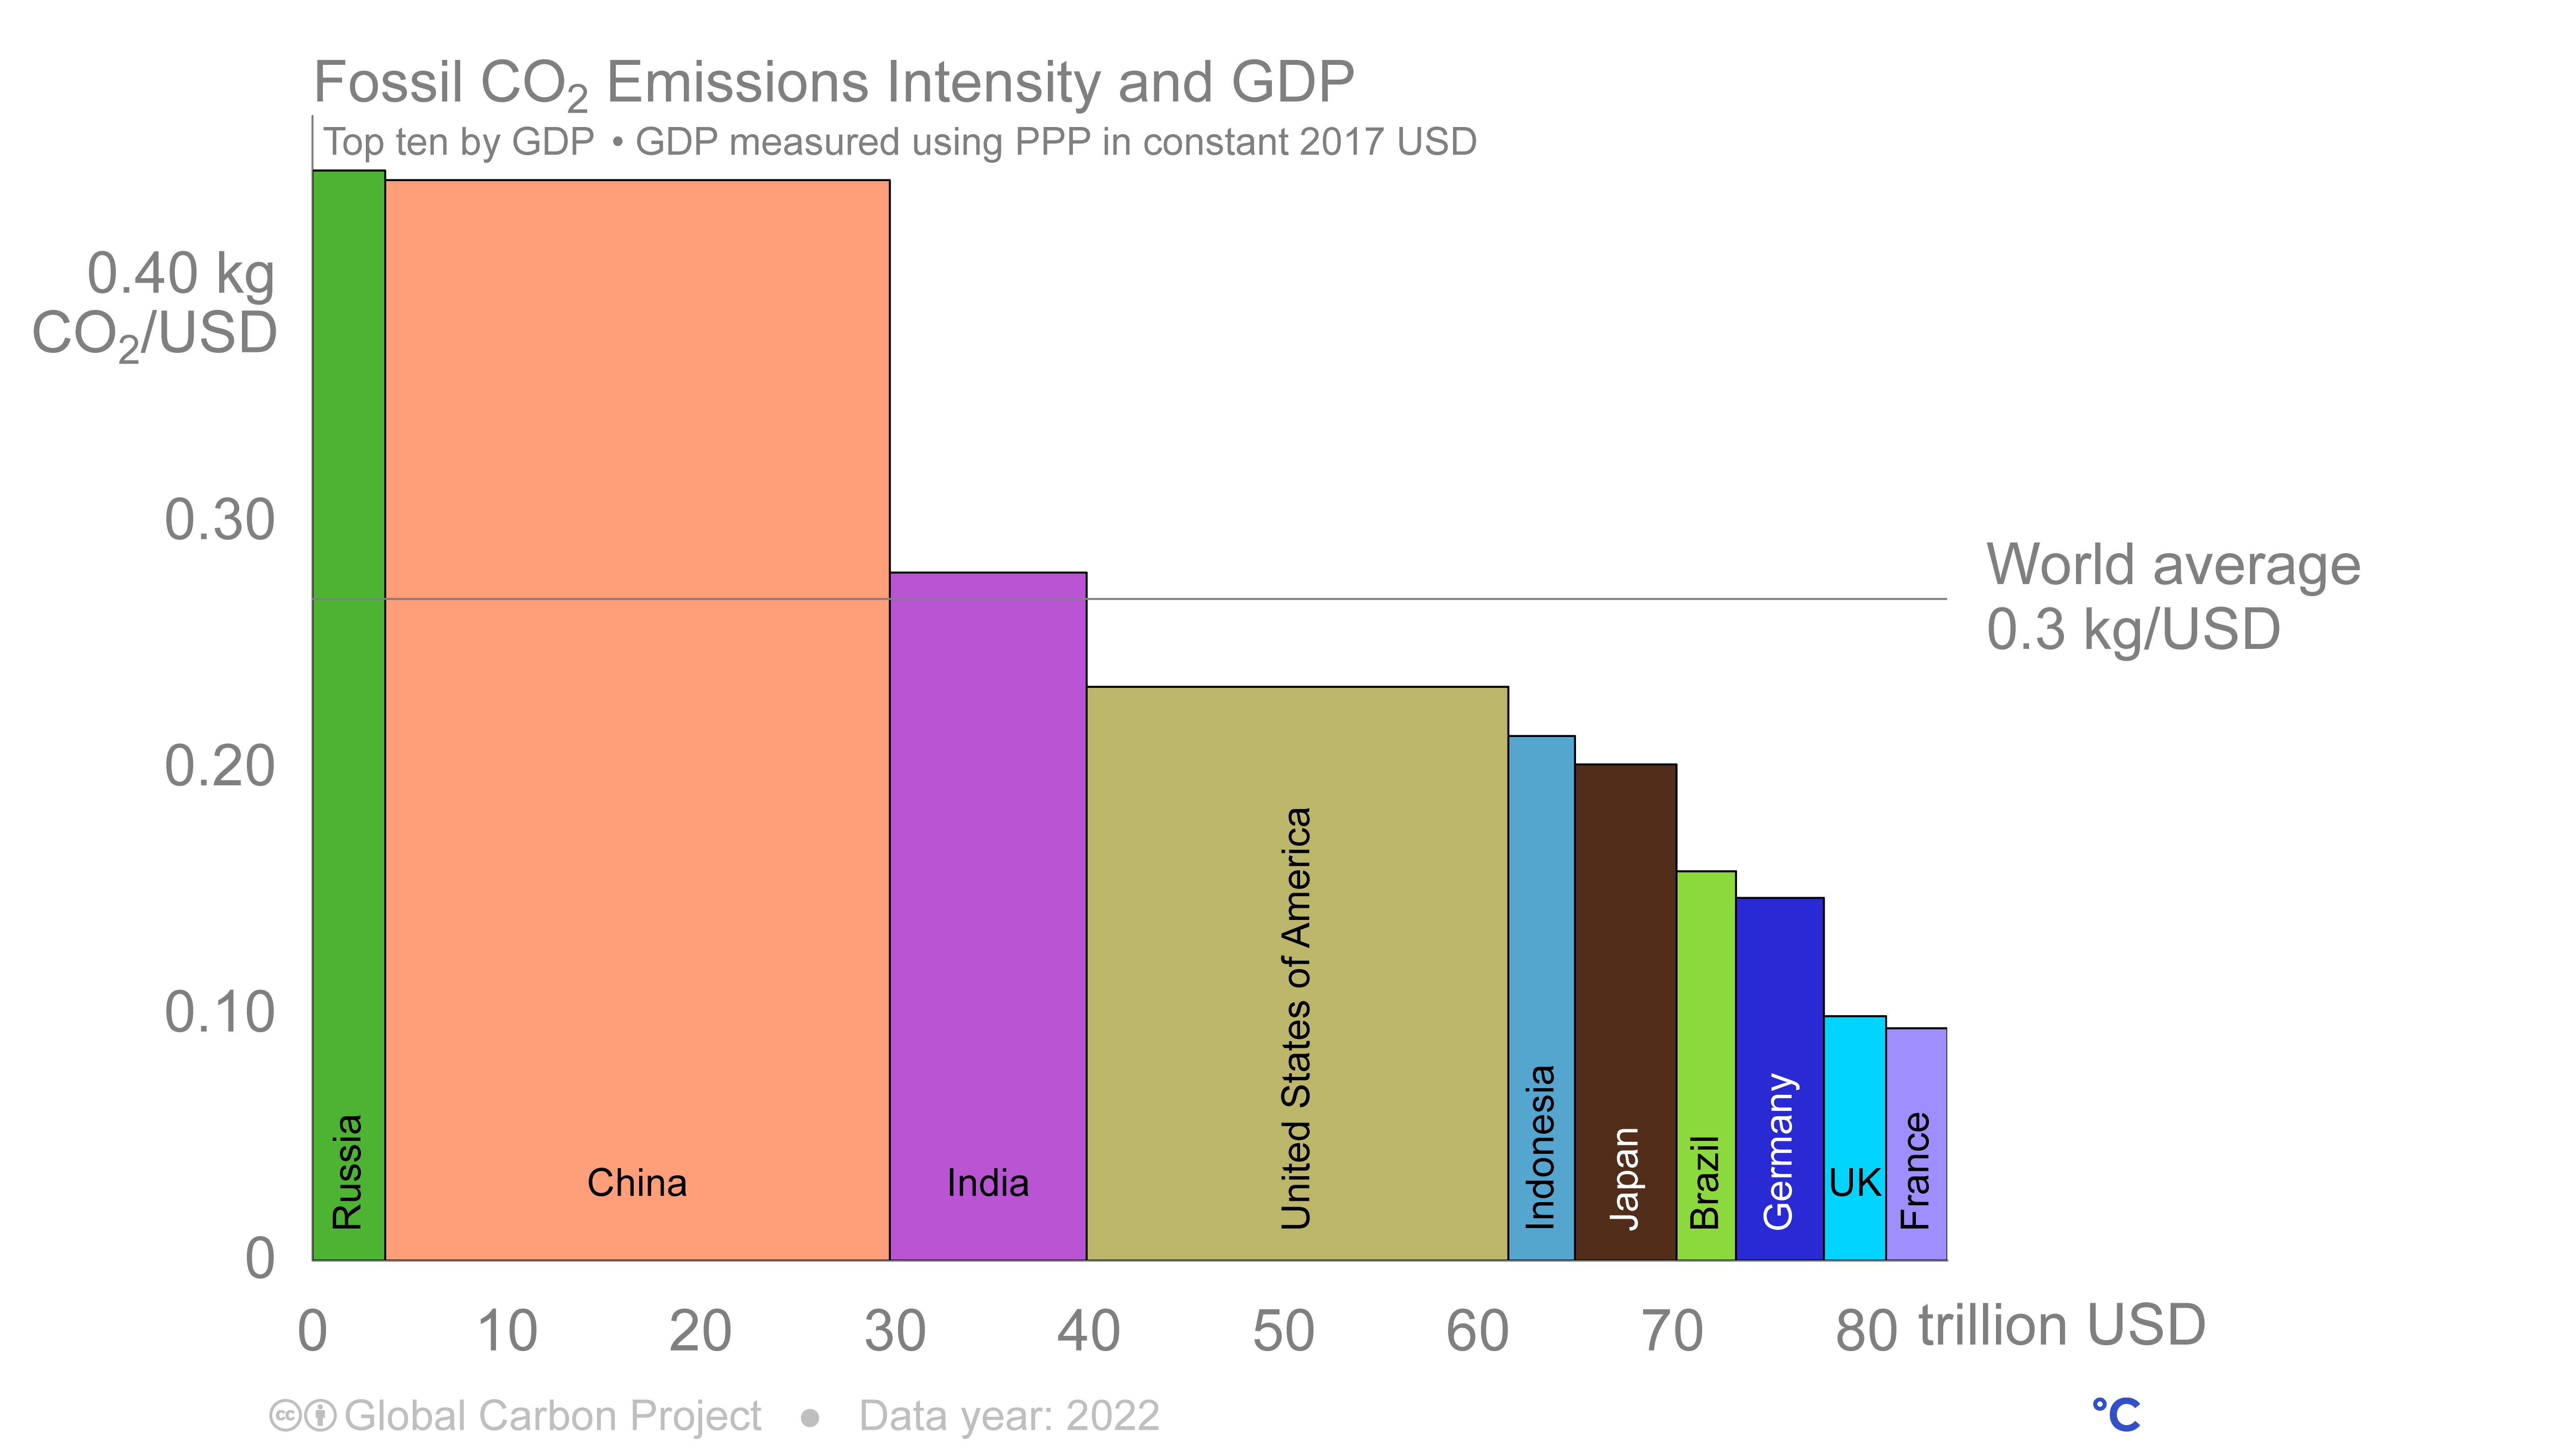
Fossil co₂ Emissions Intensity and GDP

Right click to download: CSV / PNG
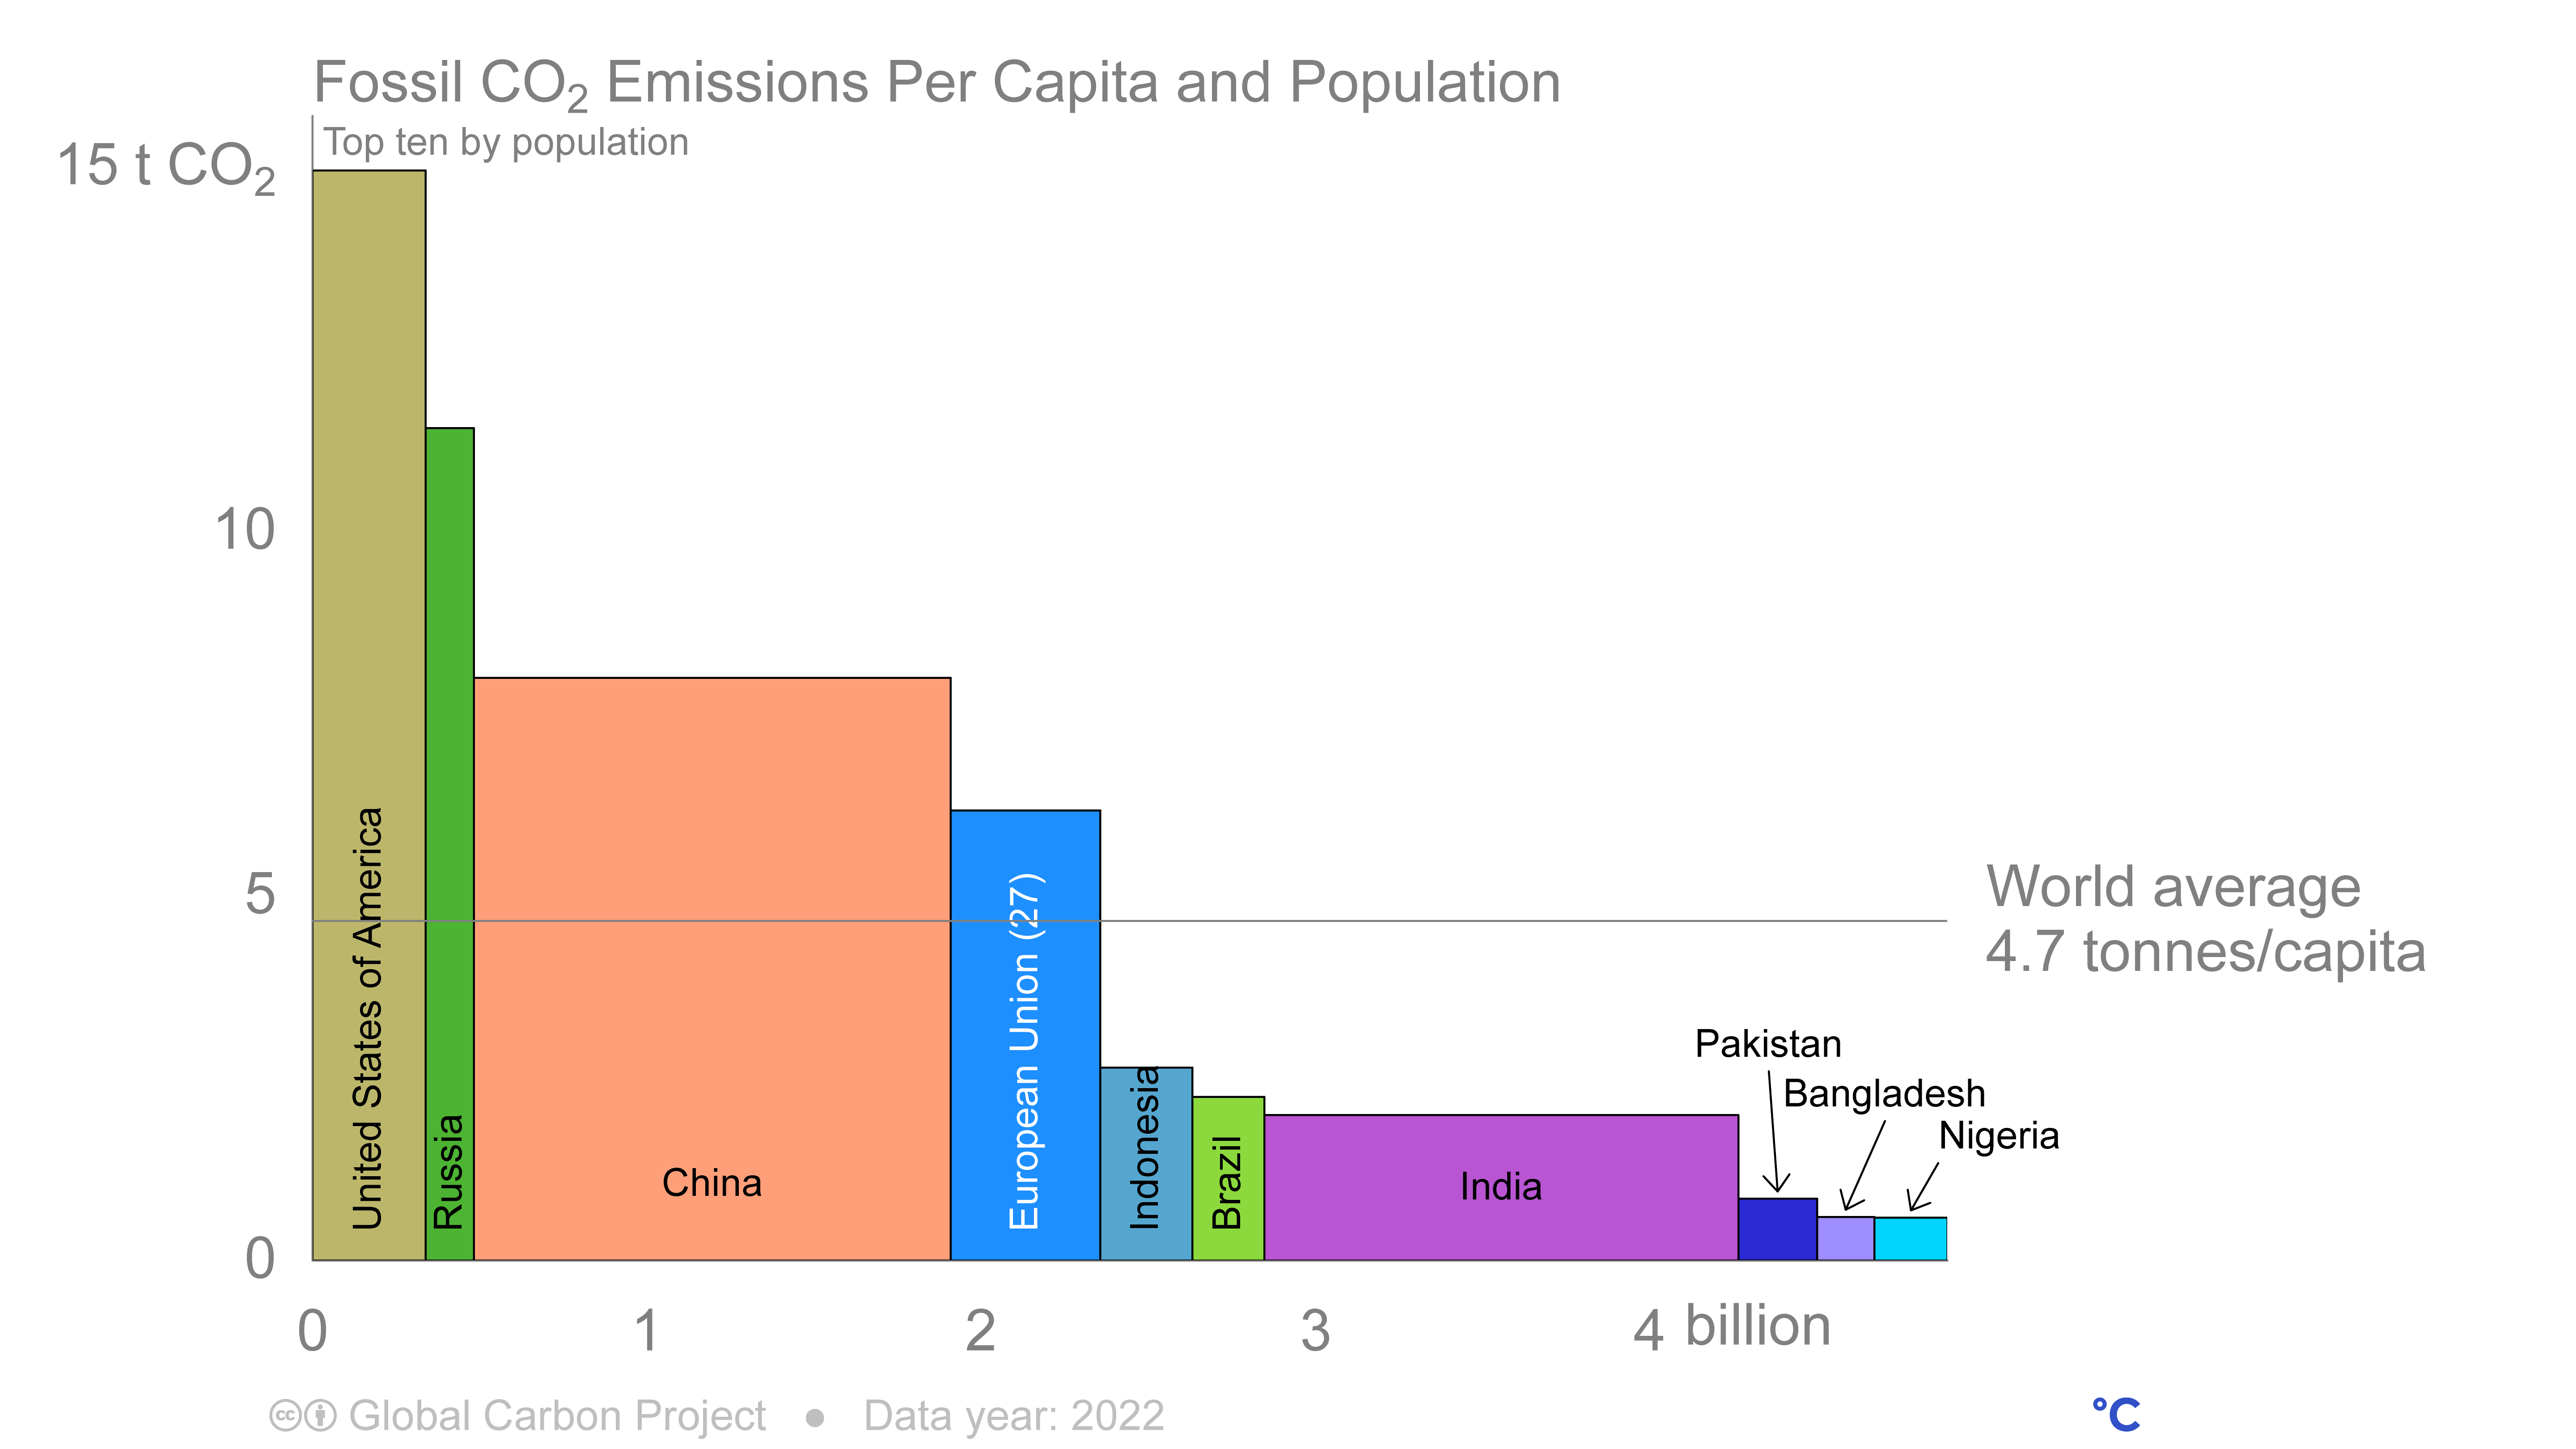
Fossil co₂ Emissions Per Capita and Population

Right click to download: CSV / PNG
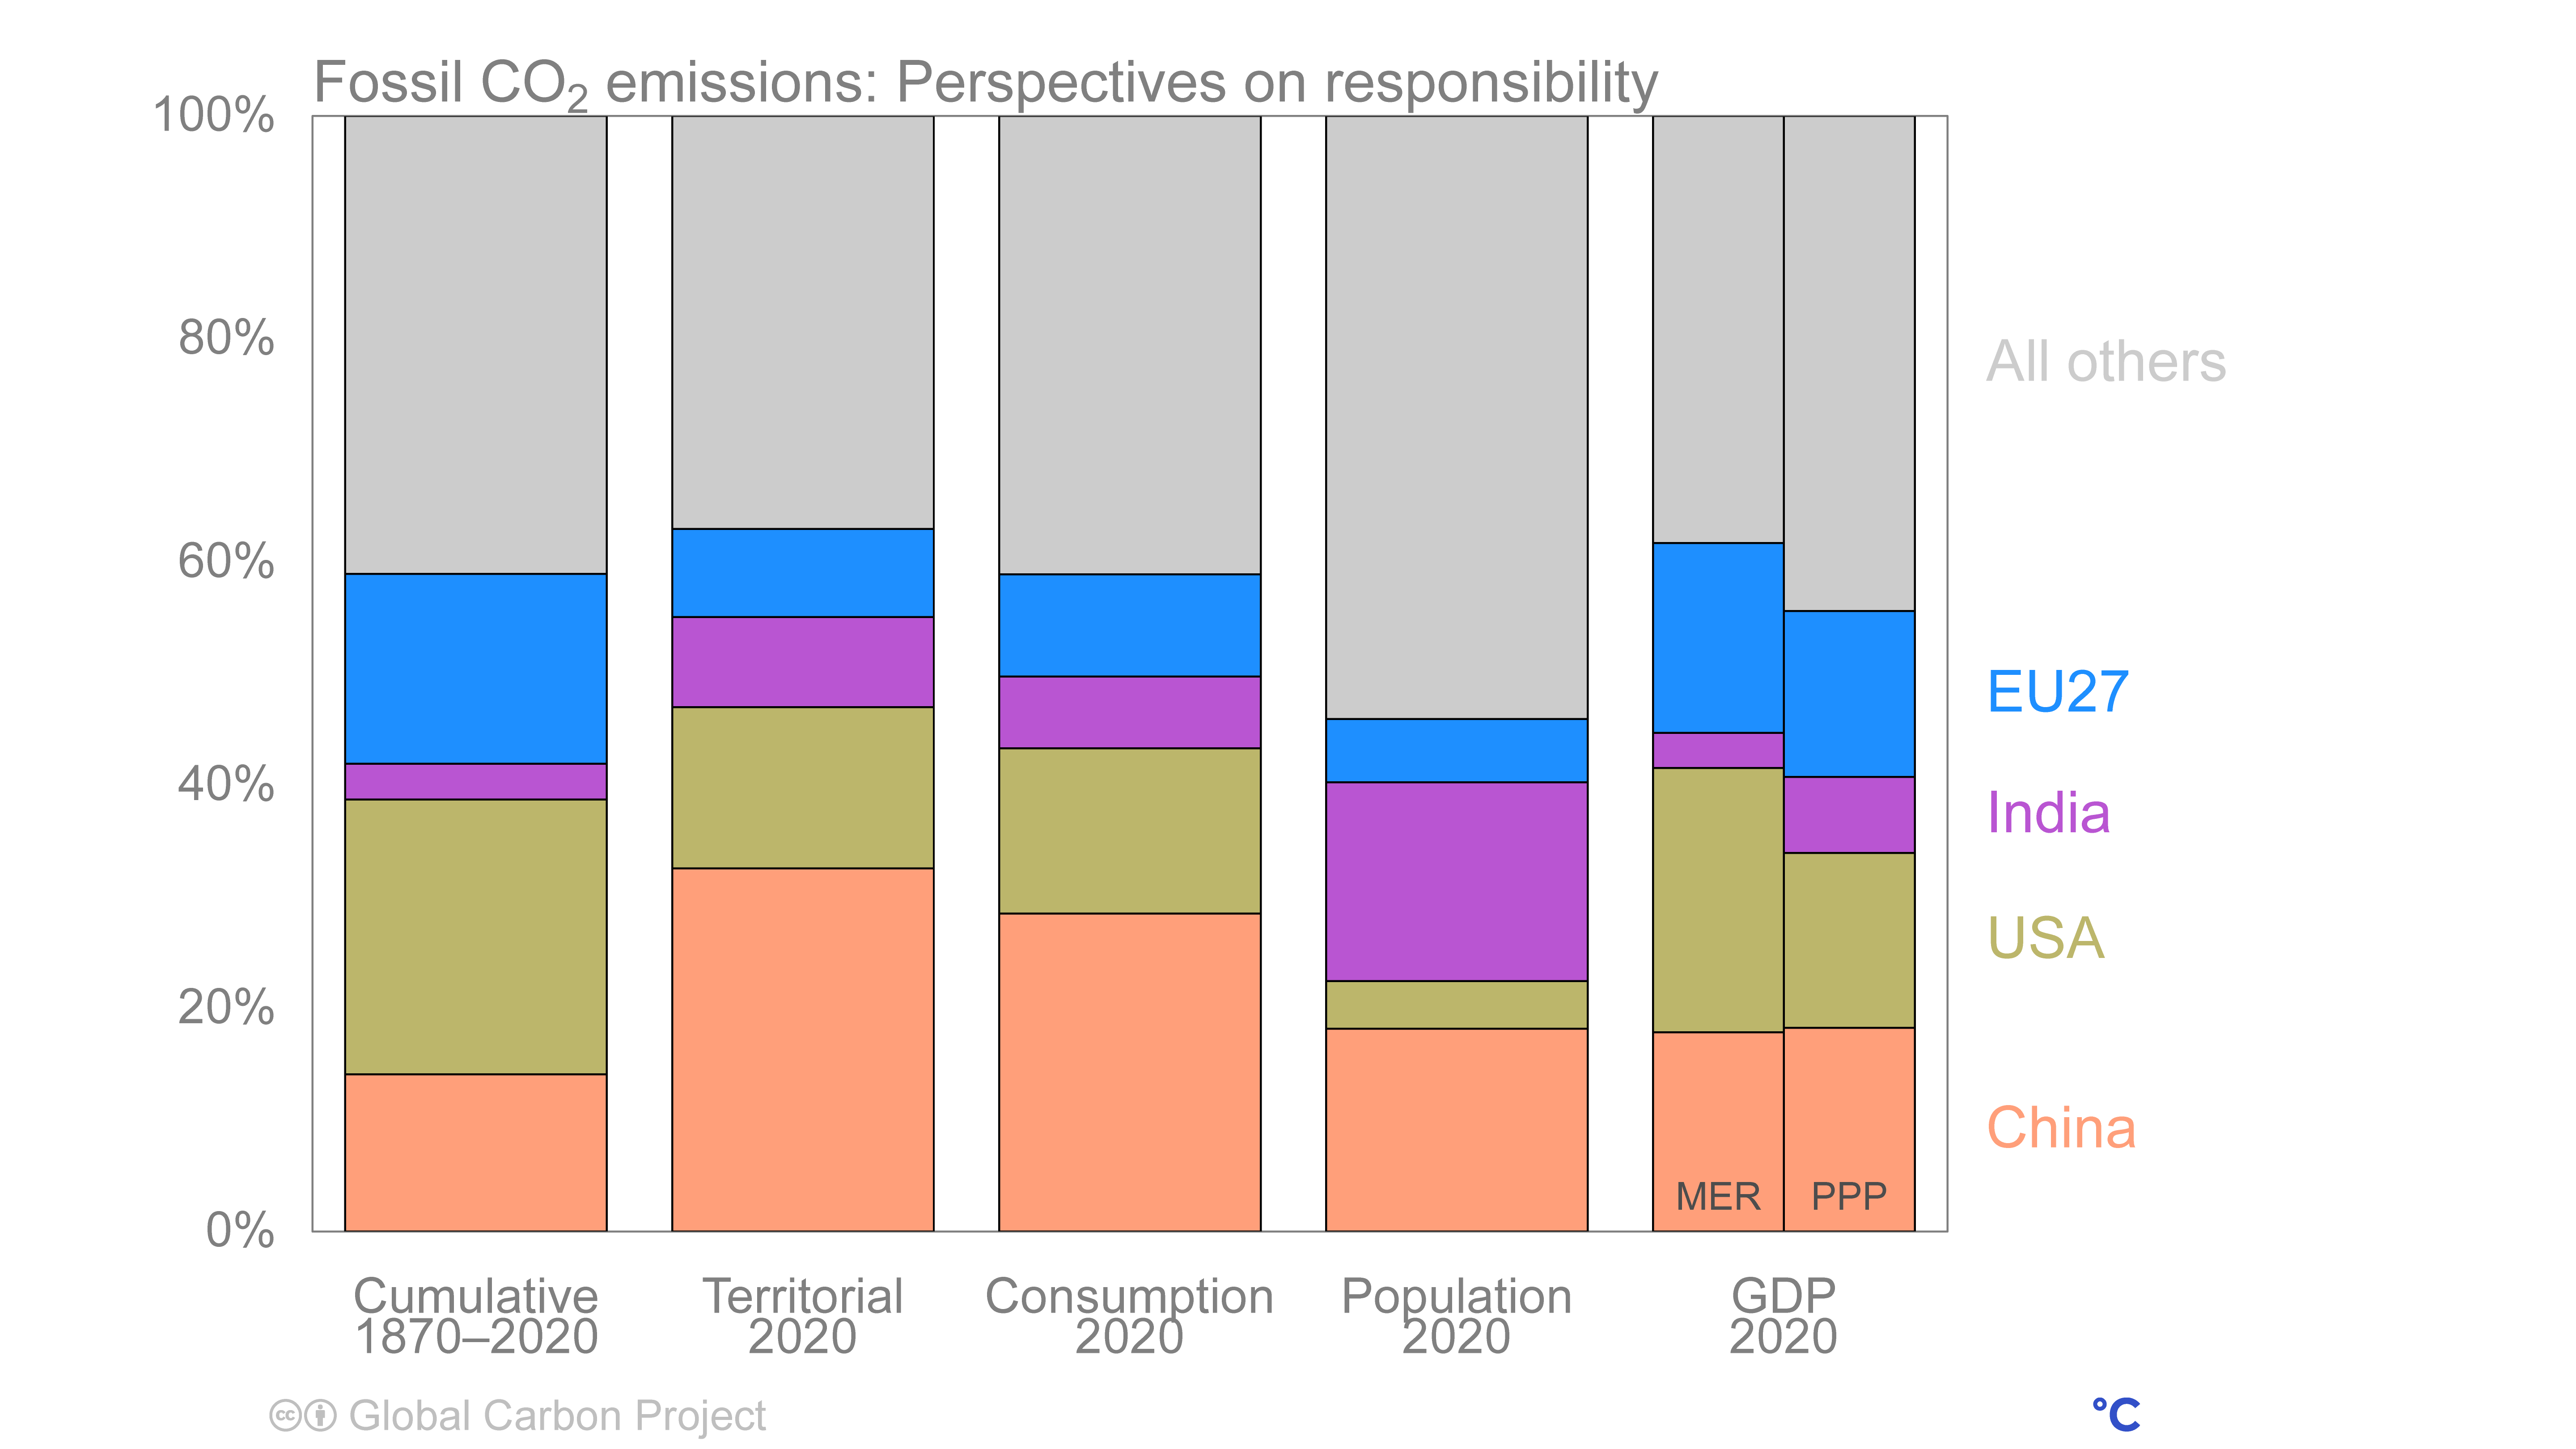
Fossil co₂ emissions: Perspectives on responsibility

Right click to download: CSV / PNG
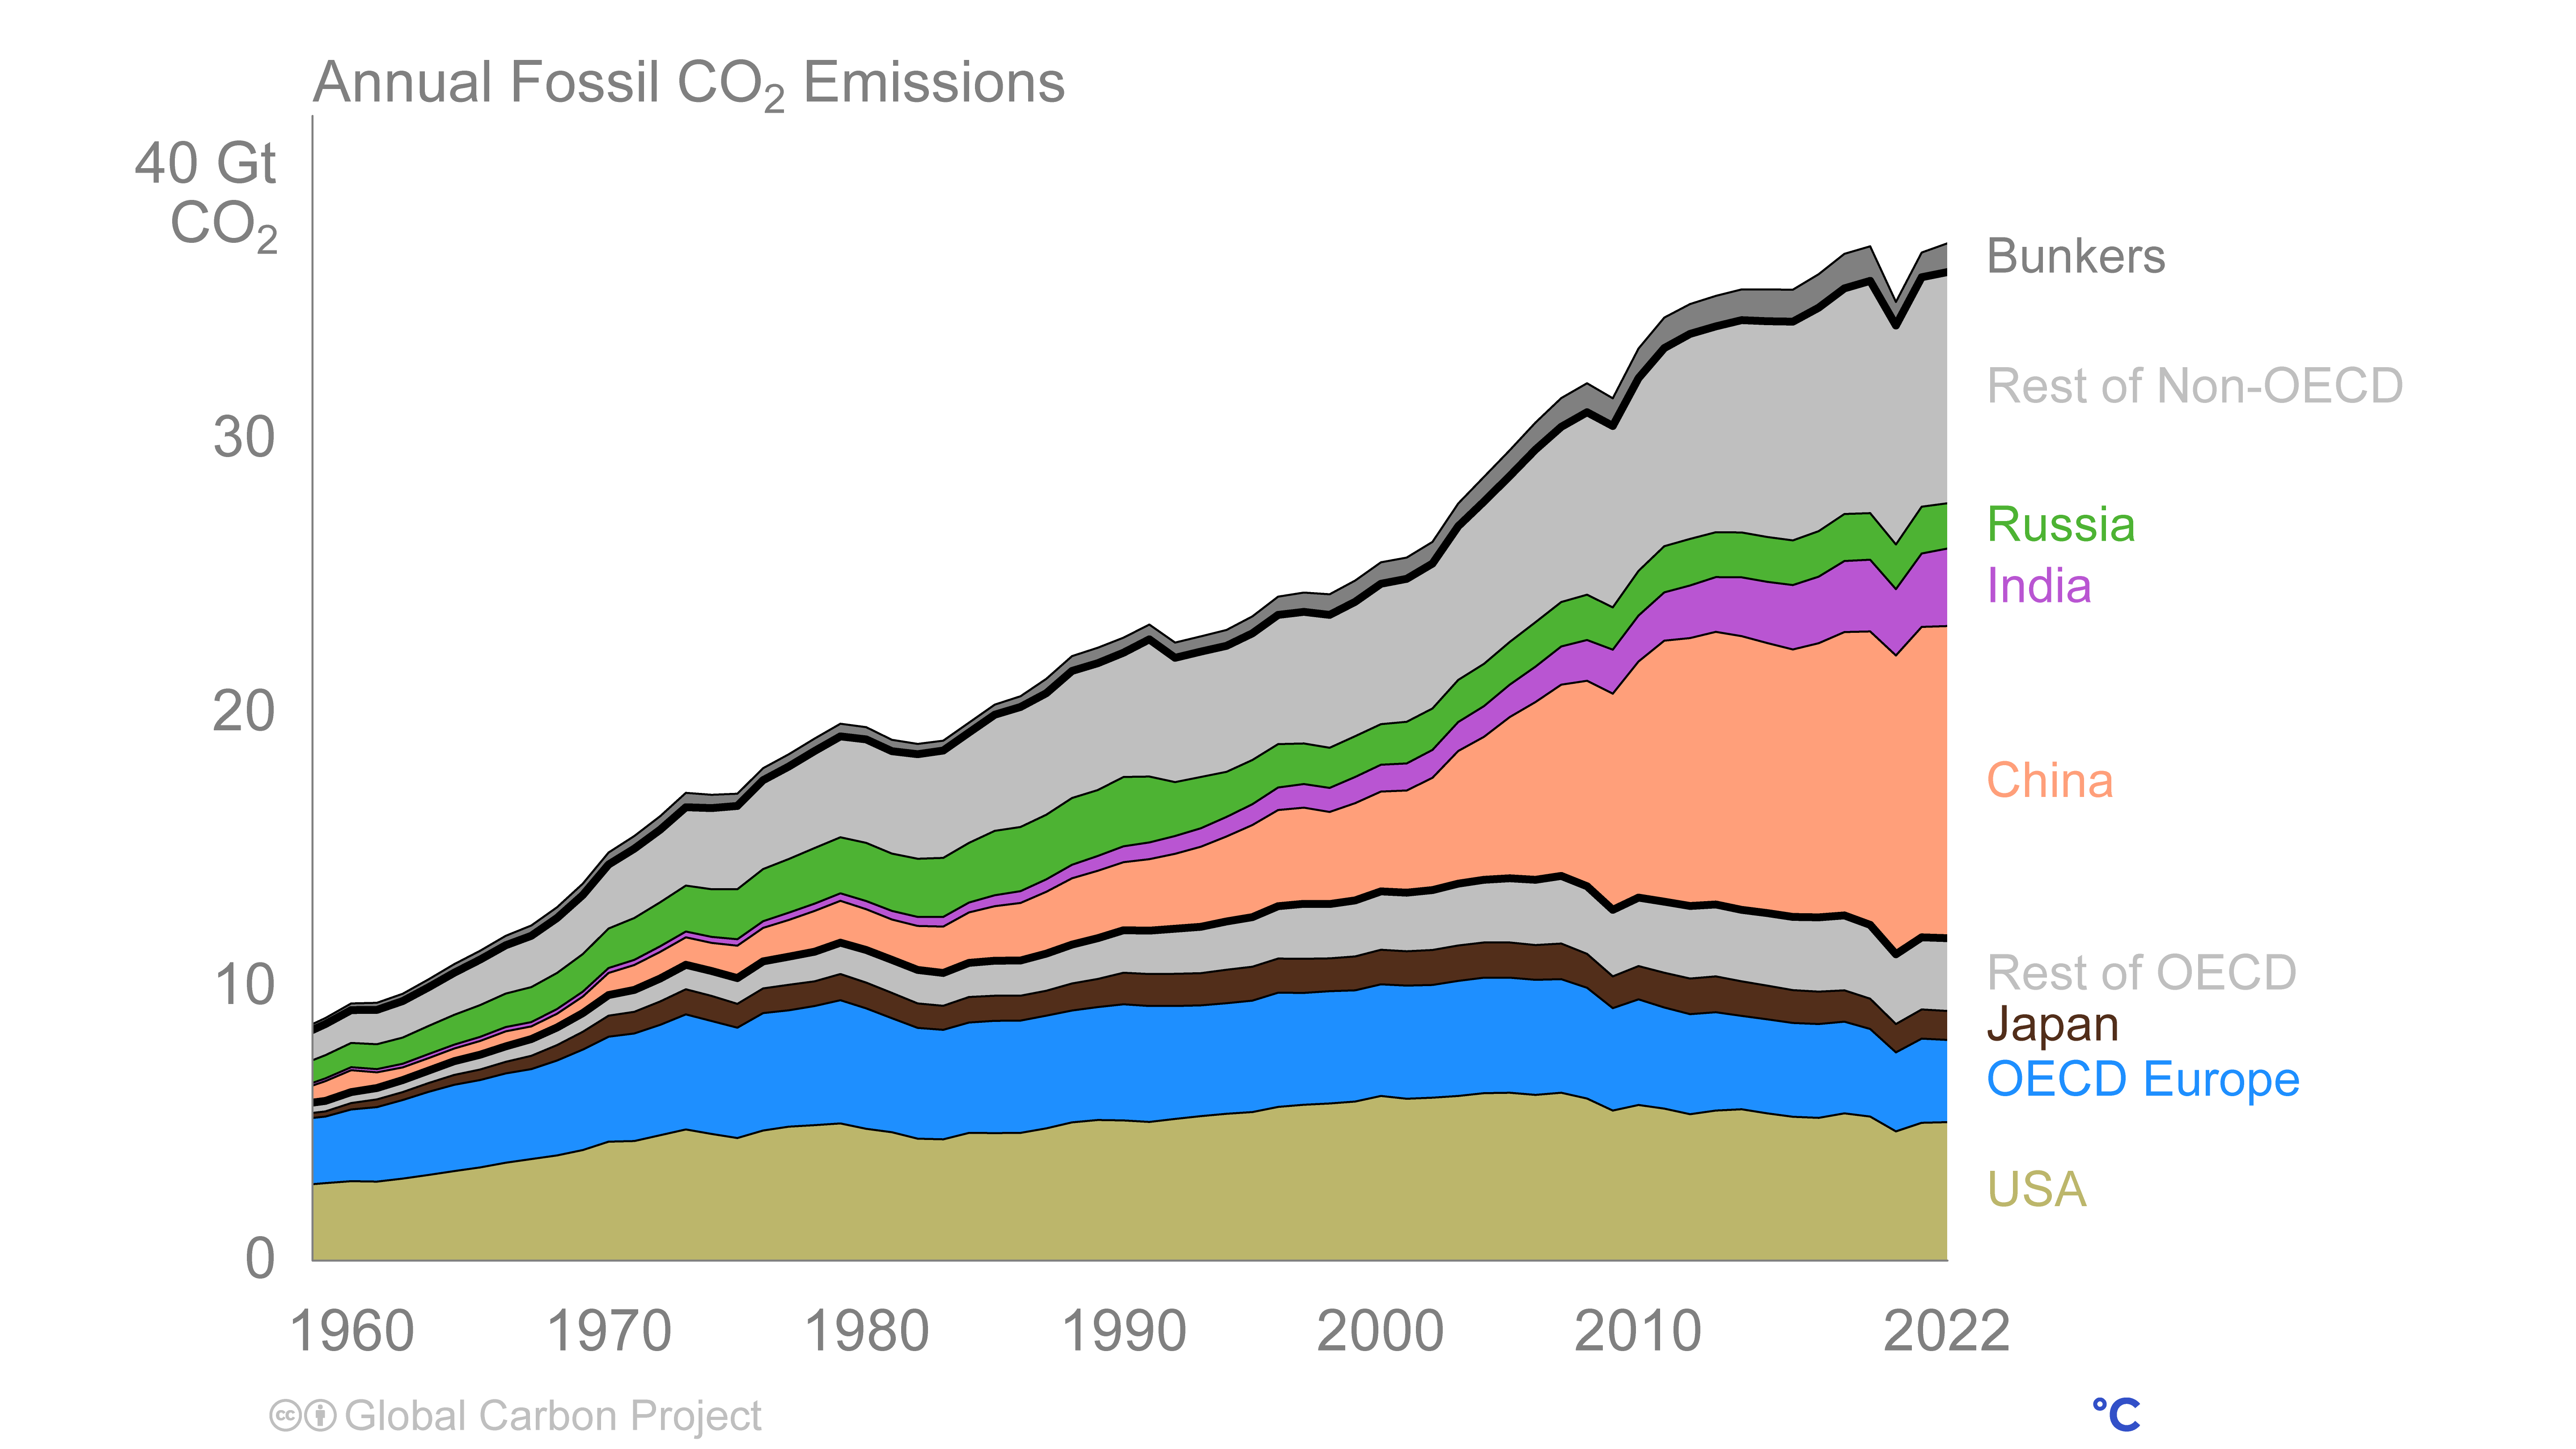
Annual Fossil co₂ Emissions

Right click to download: CSV / PNG
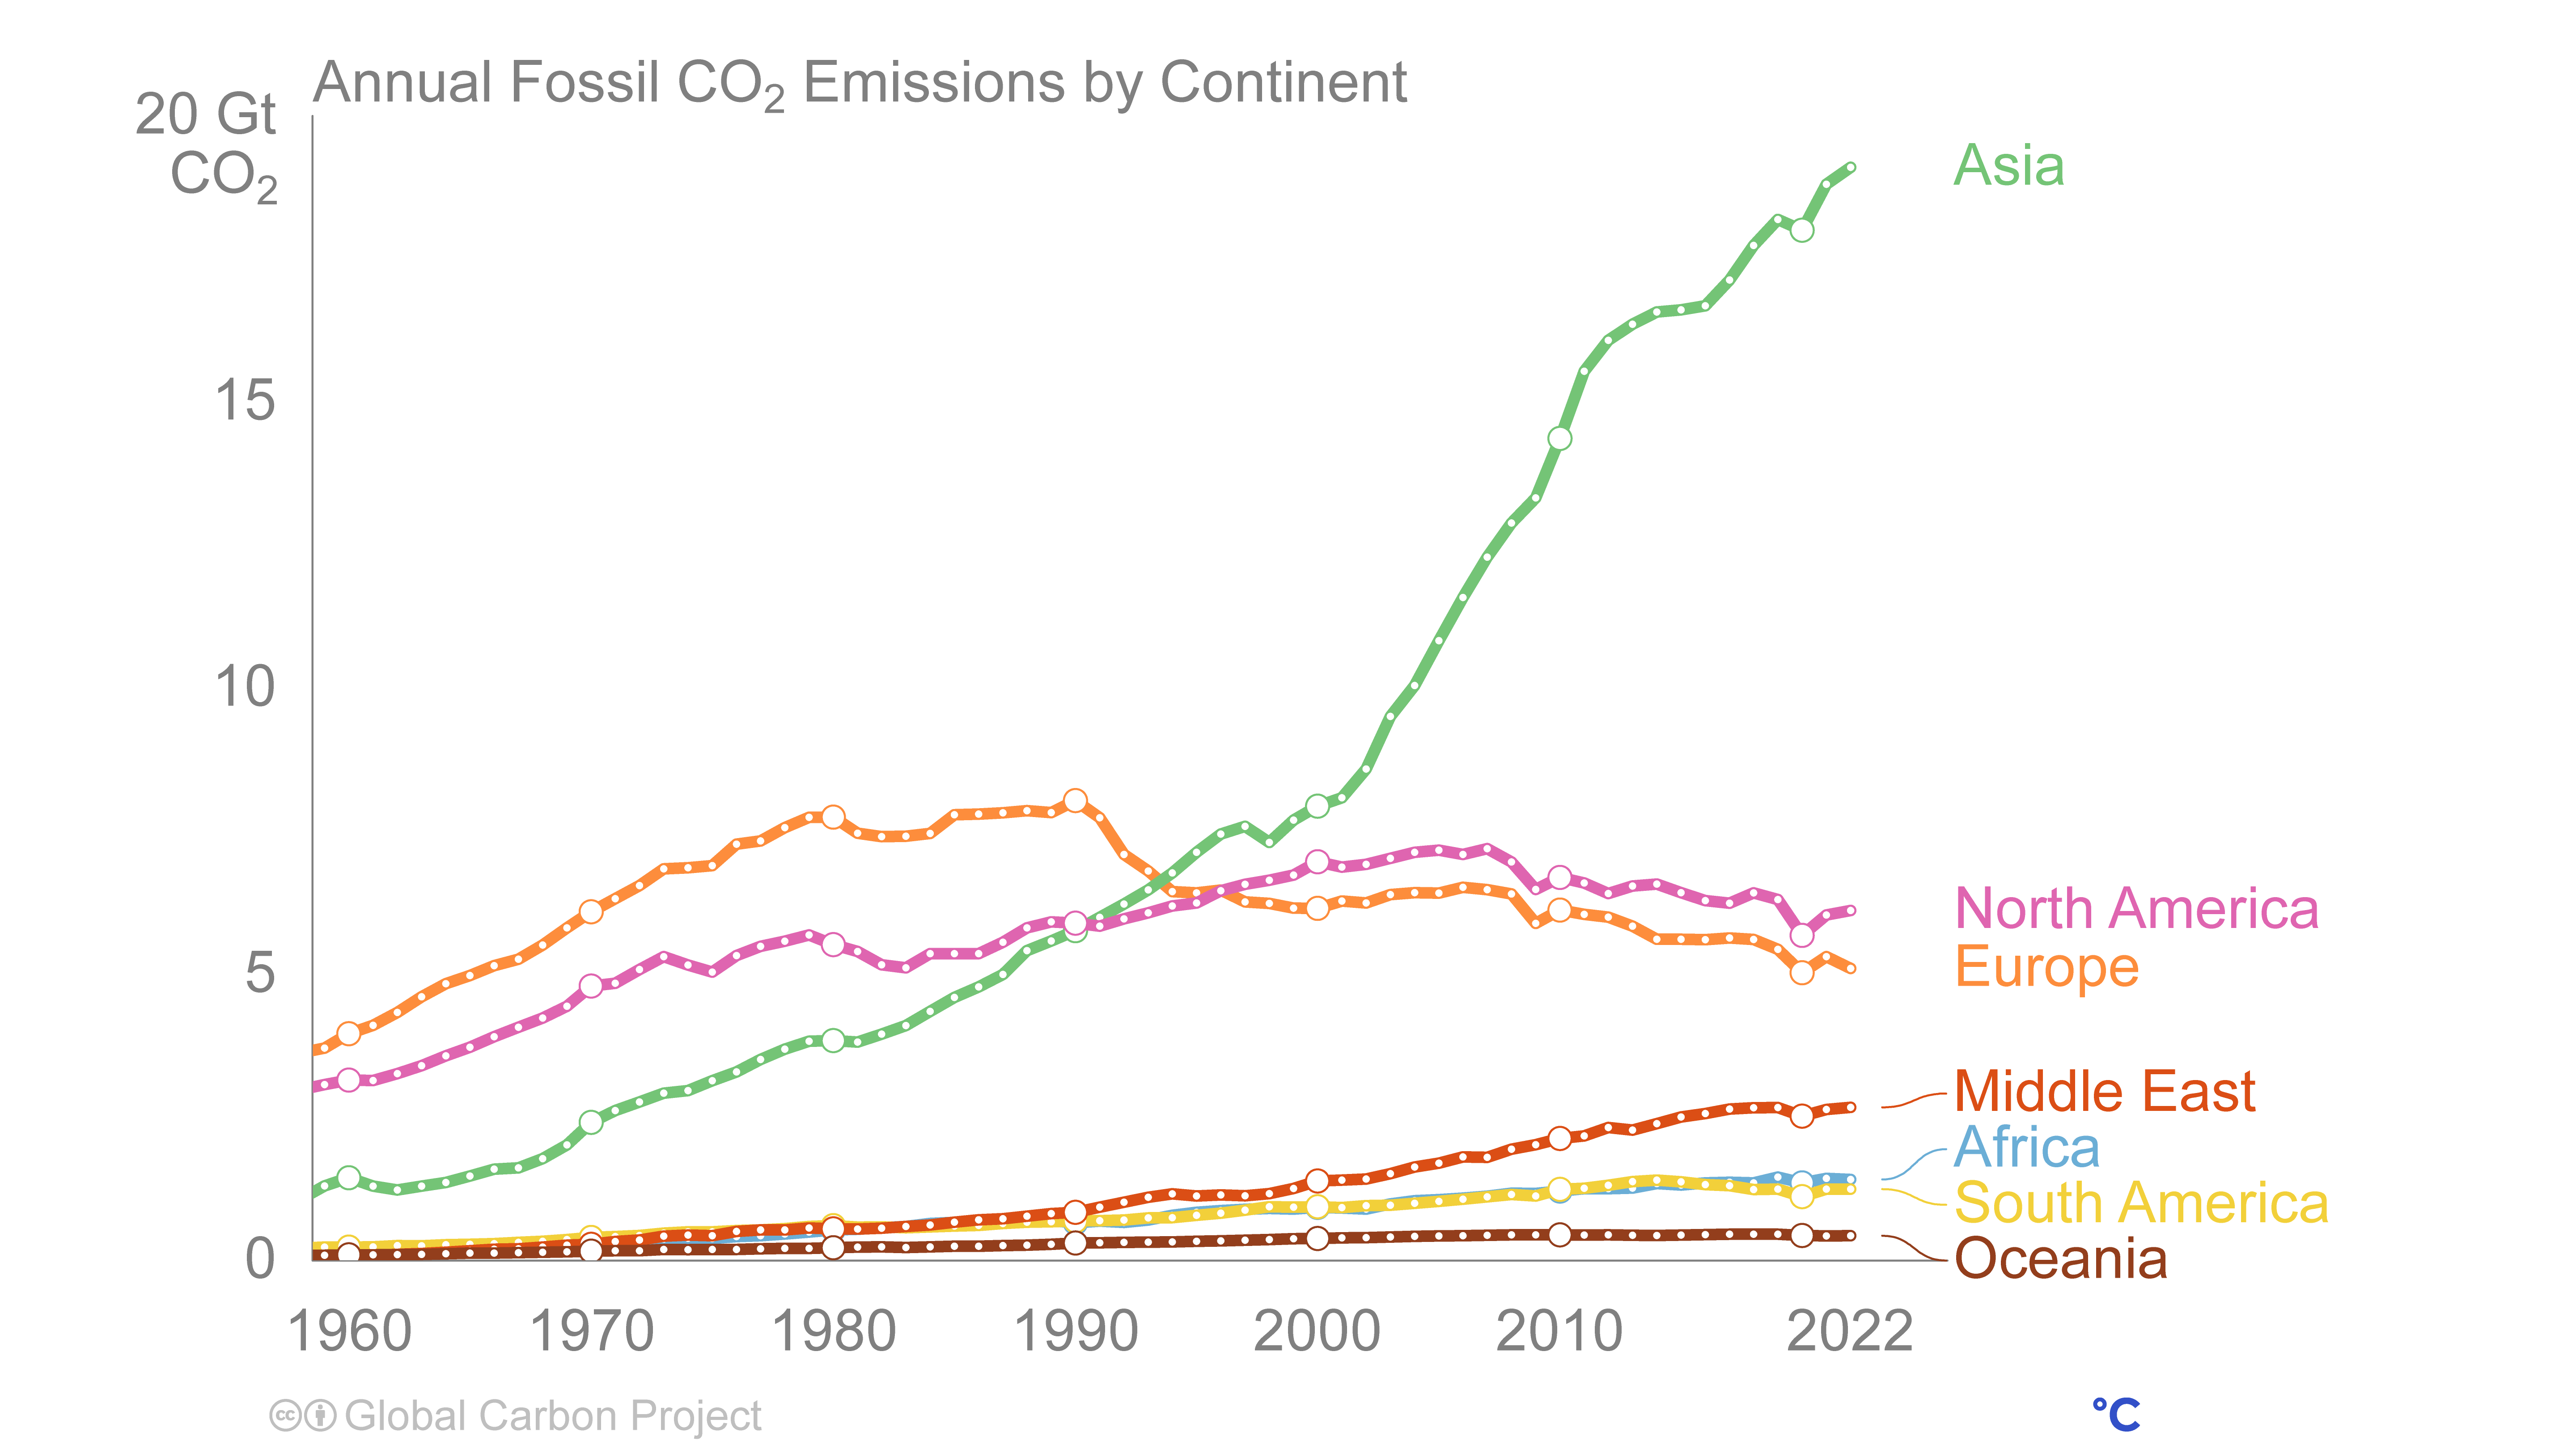
Annual Fossil co₂ Emissions by Continent

Right click to download: CSV / PNG
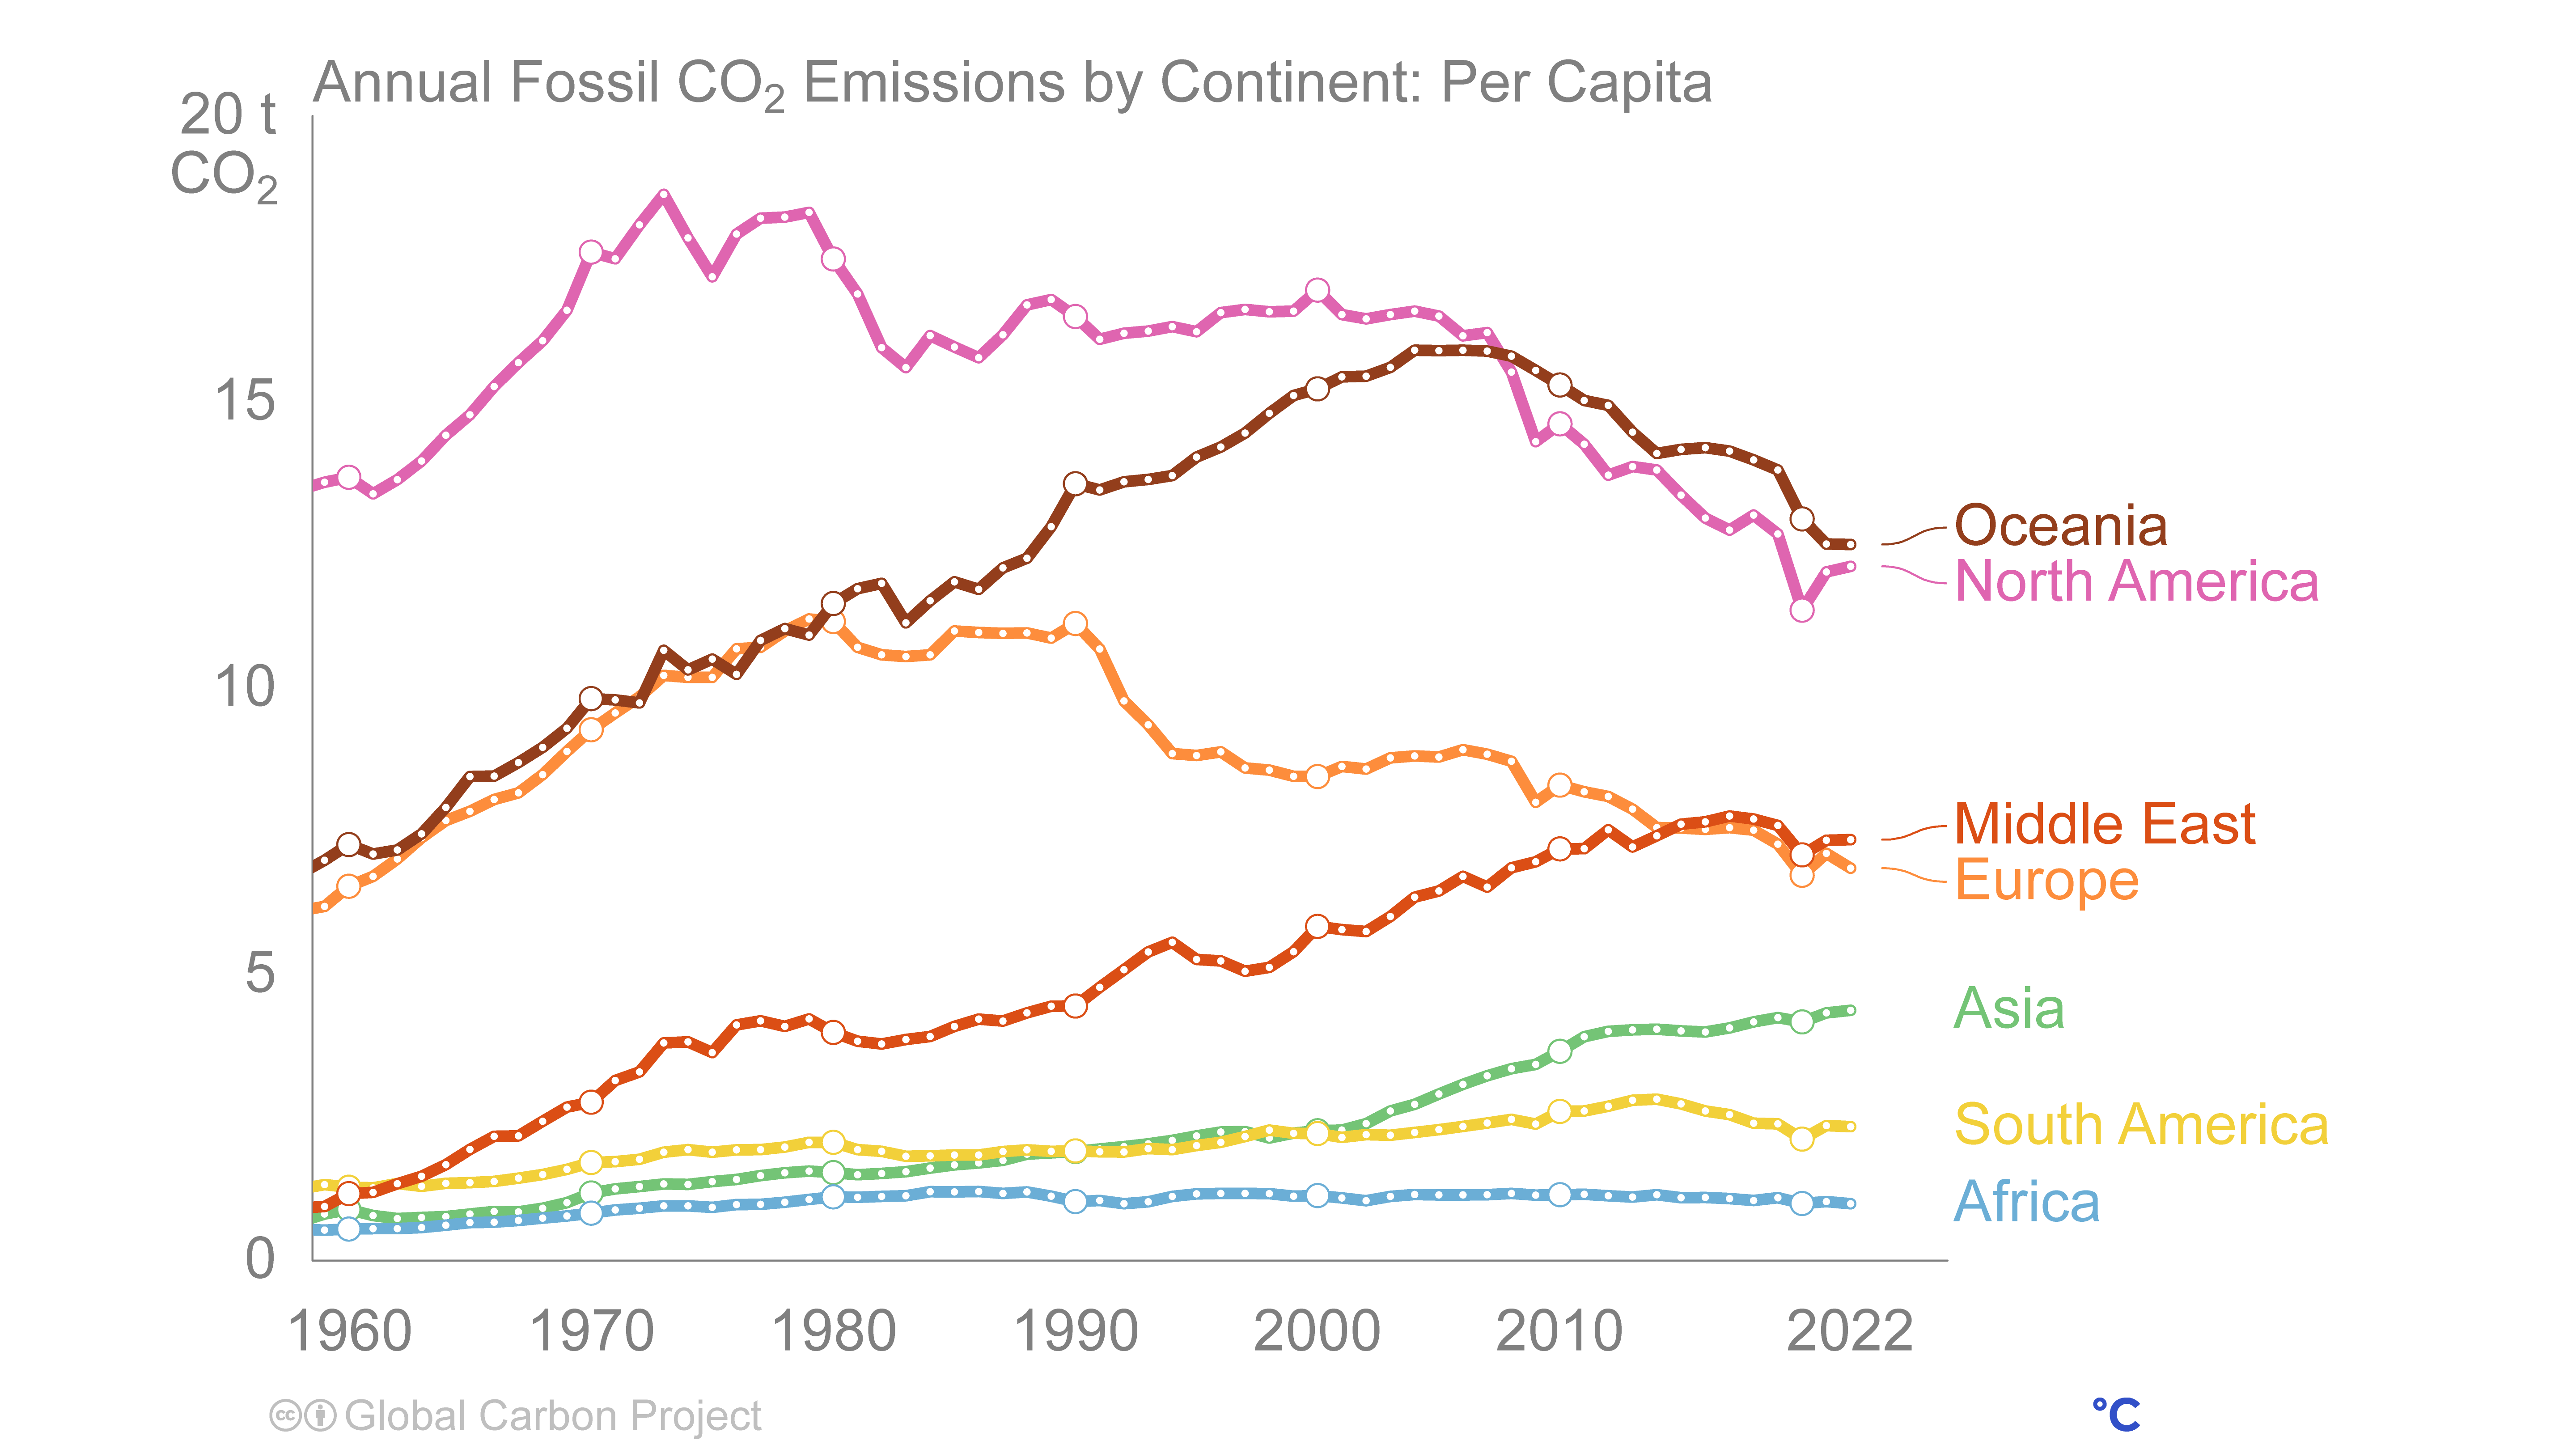
Annual Fossil co₂ Emissions by Continent: Per Capita

Right click to download: CSV / PNG
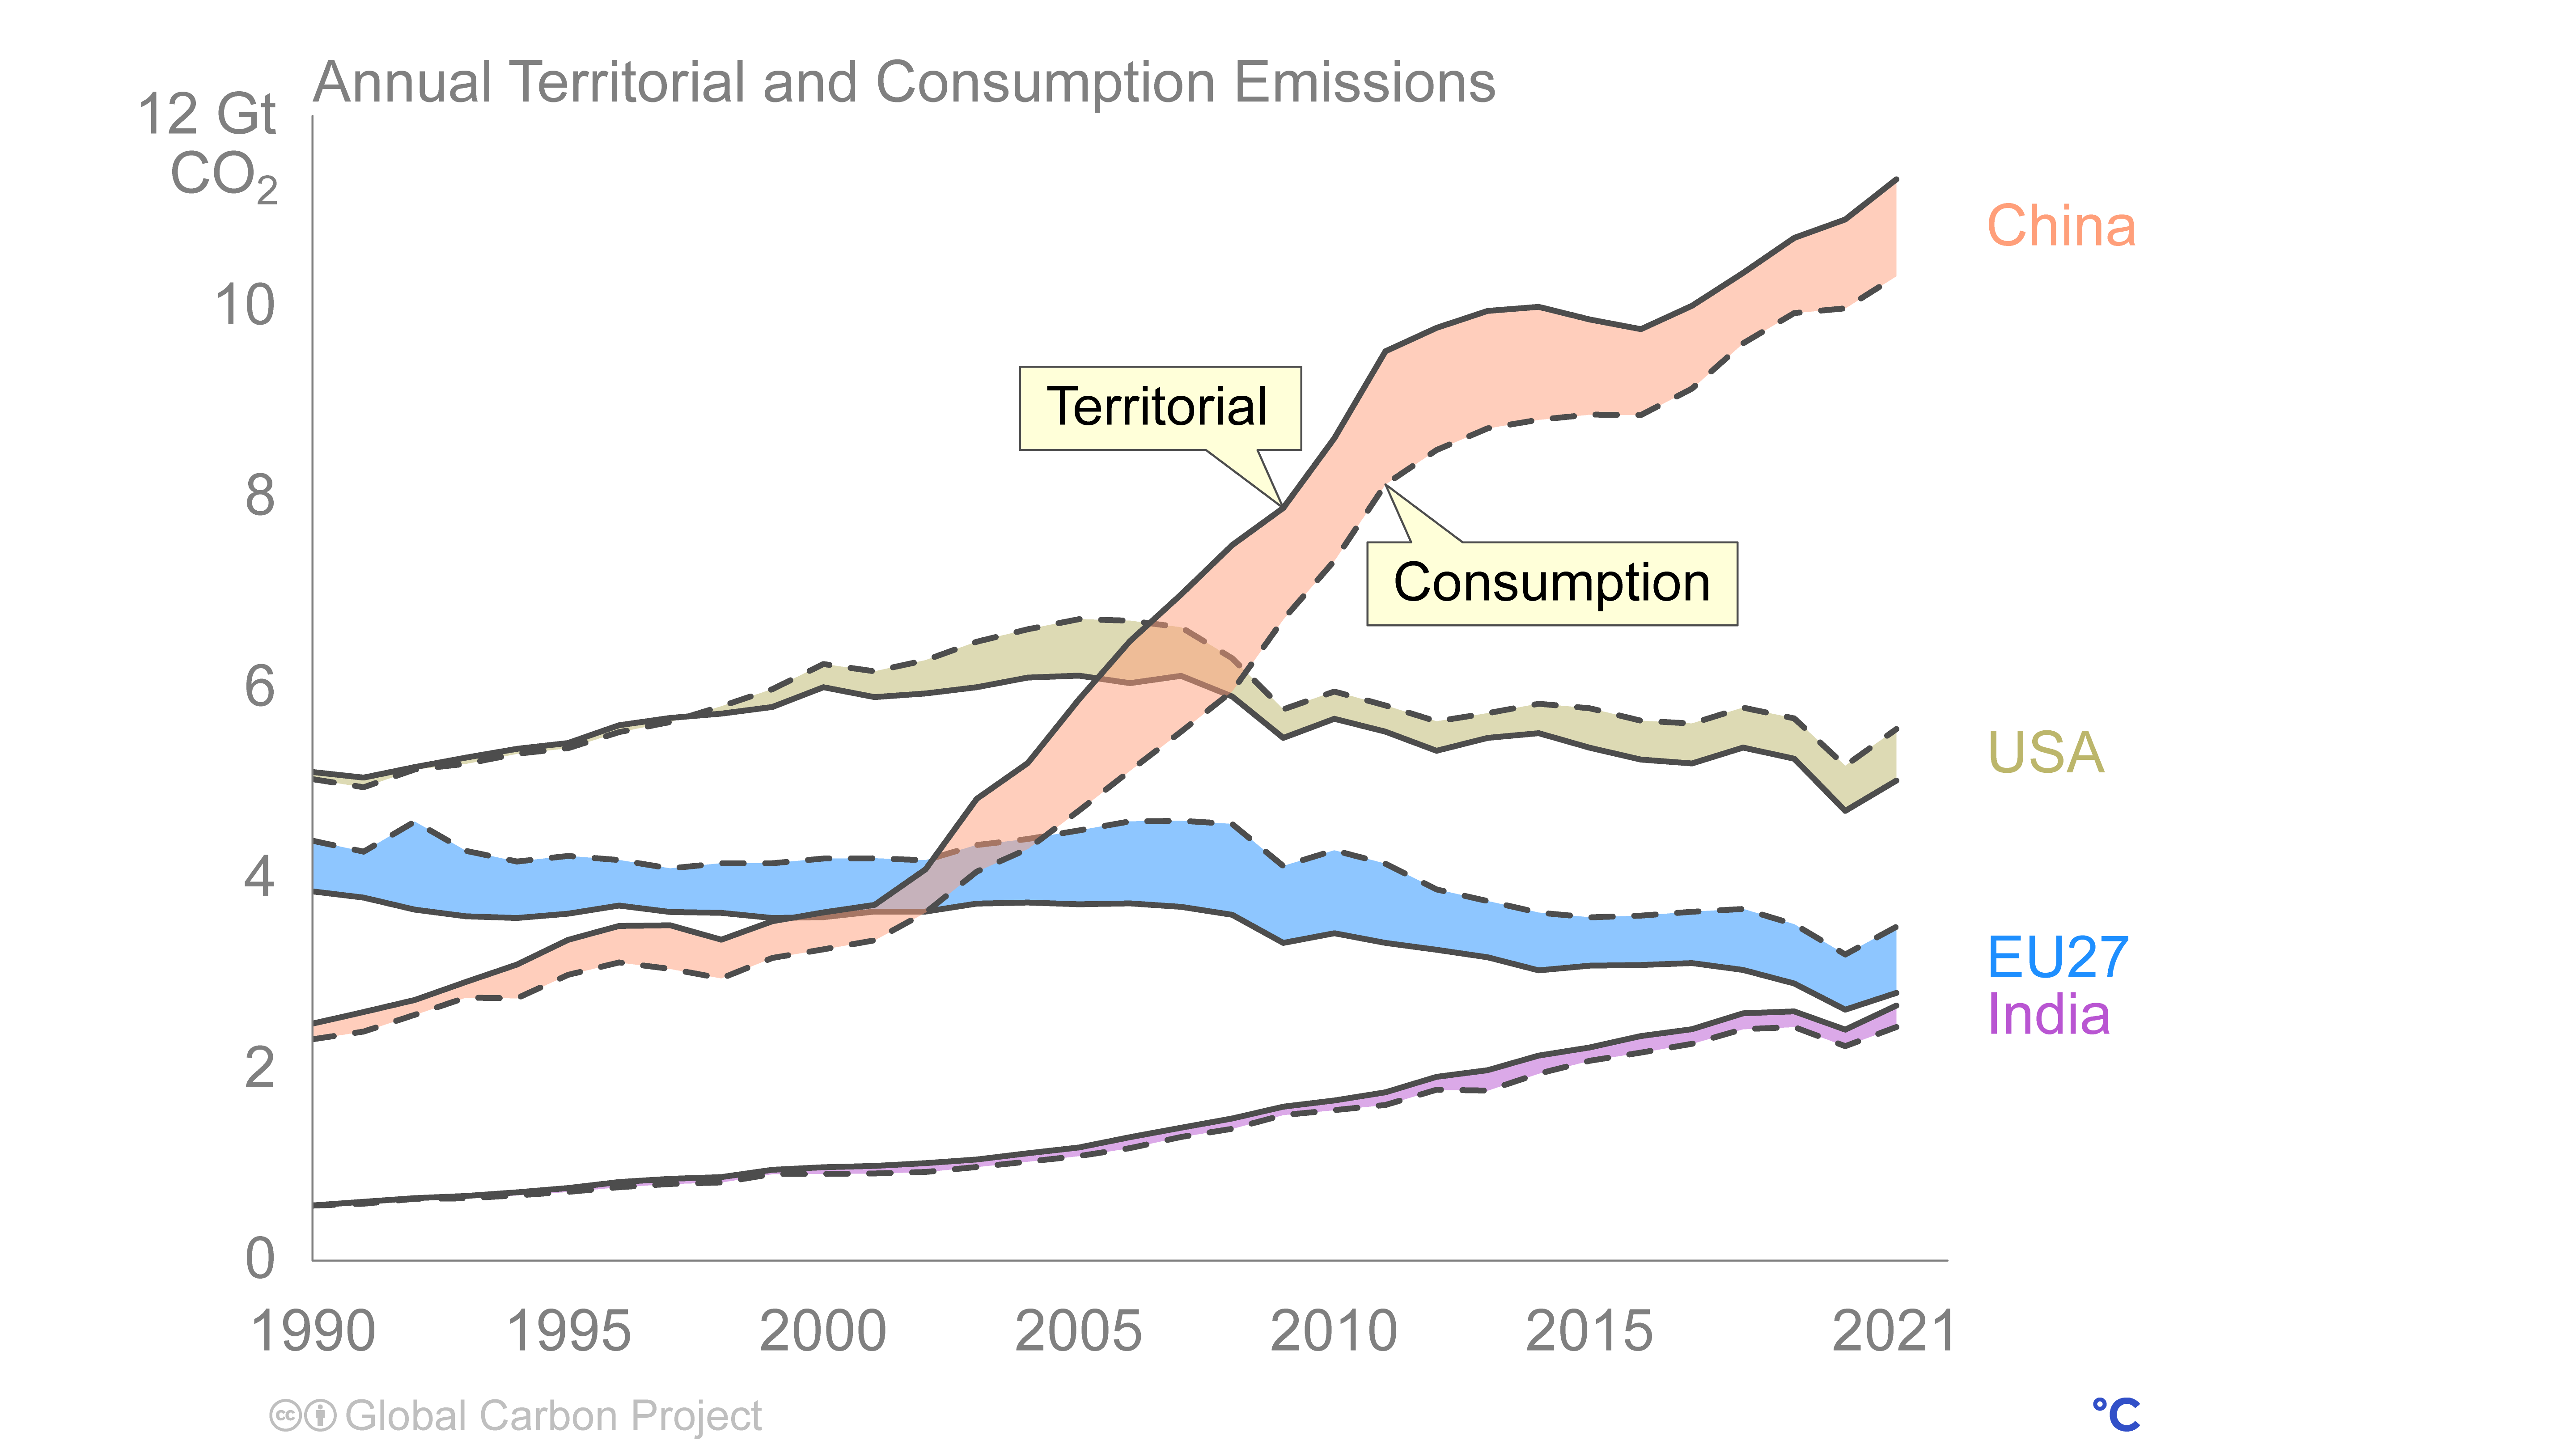
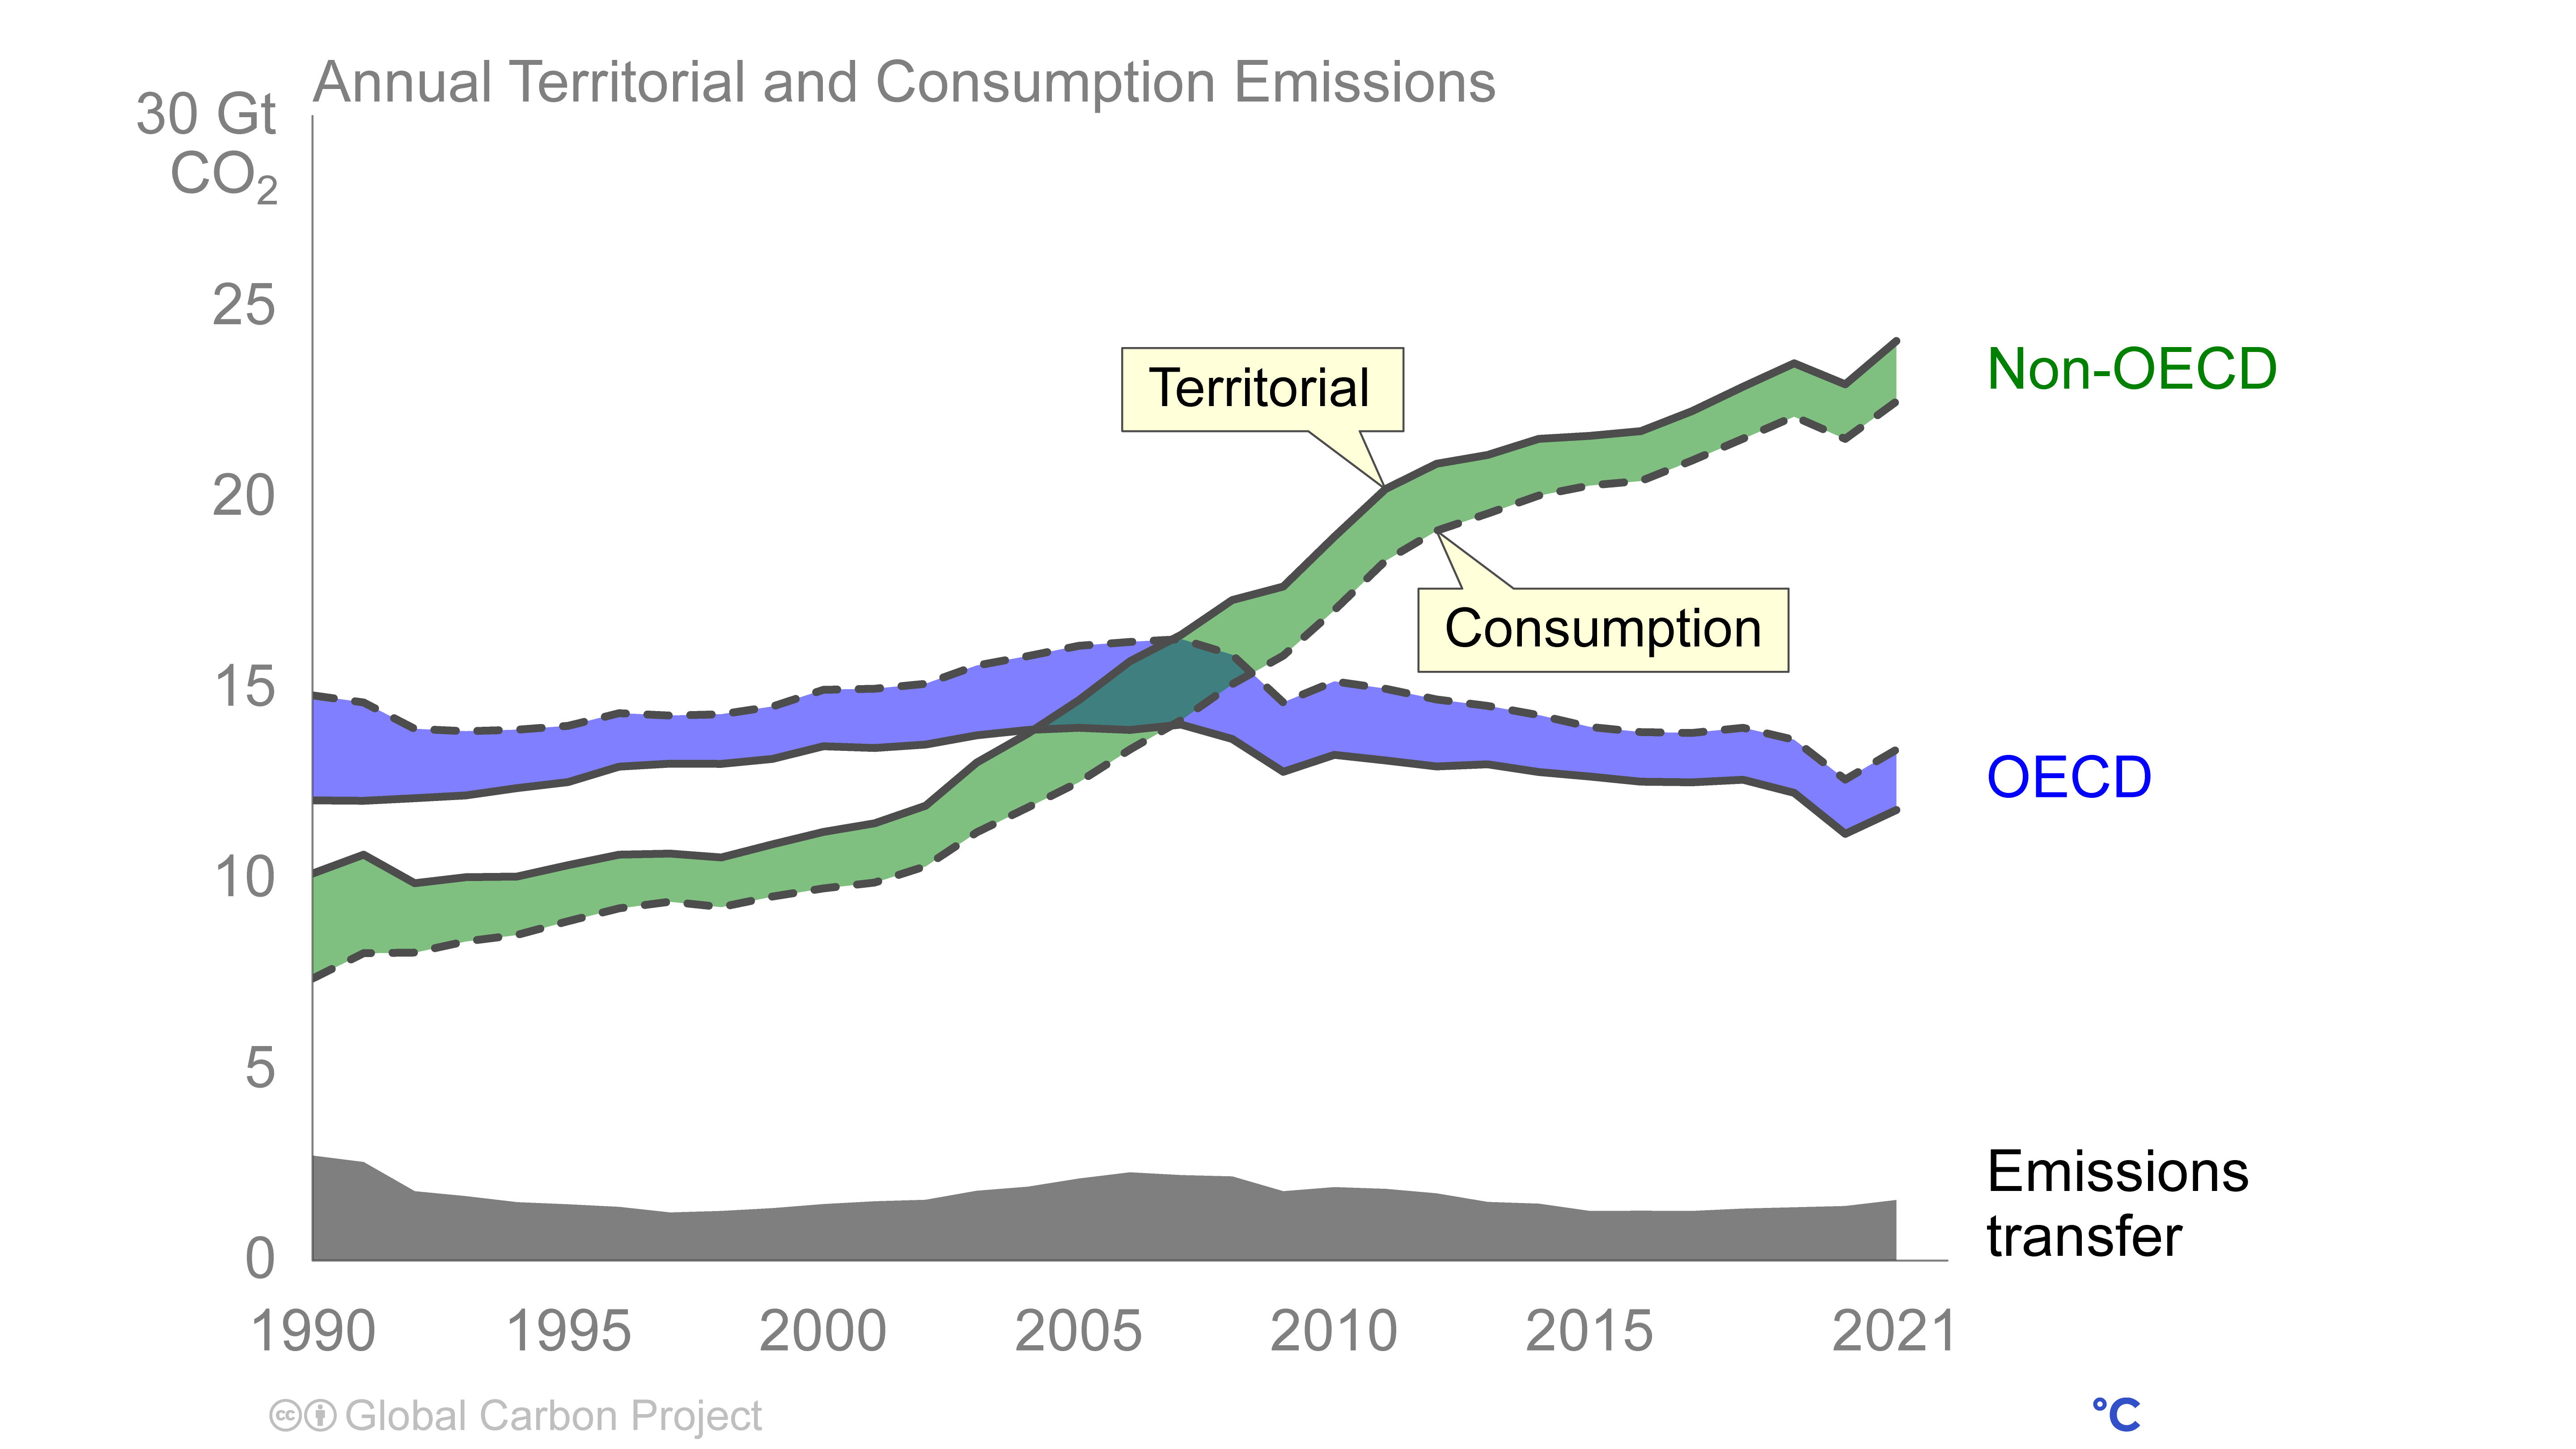
Annual Territorial and Consumption Emissions

Right click to download: CSV / PNG
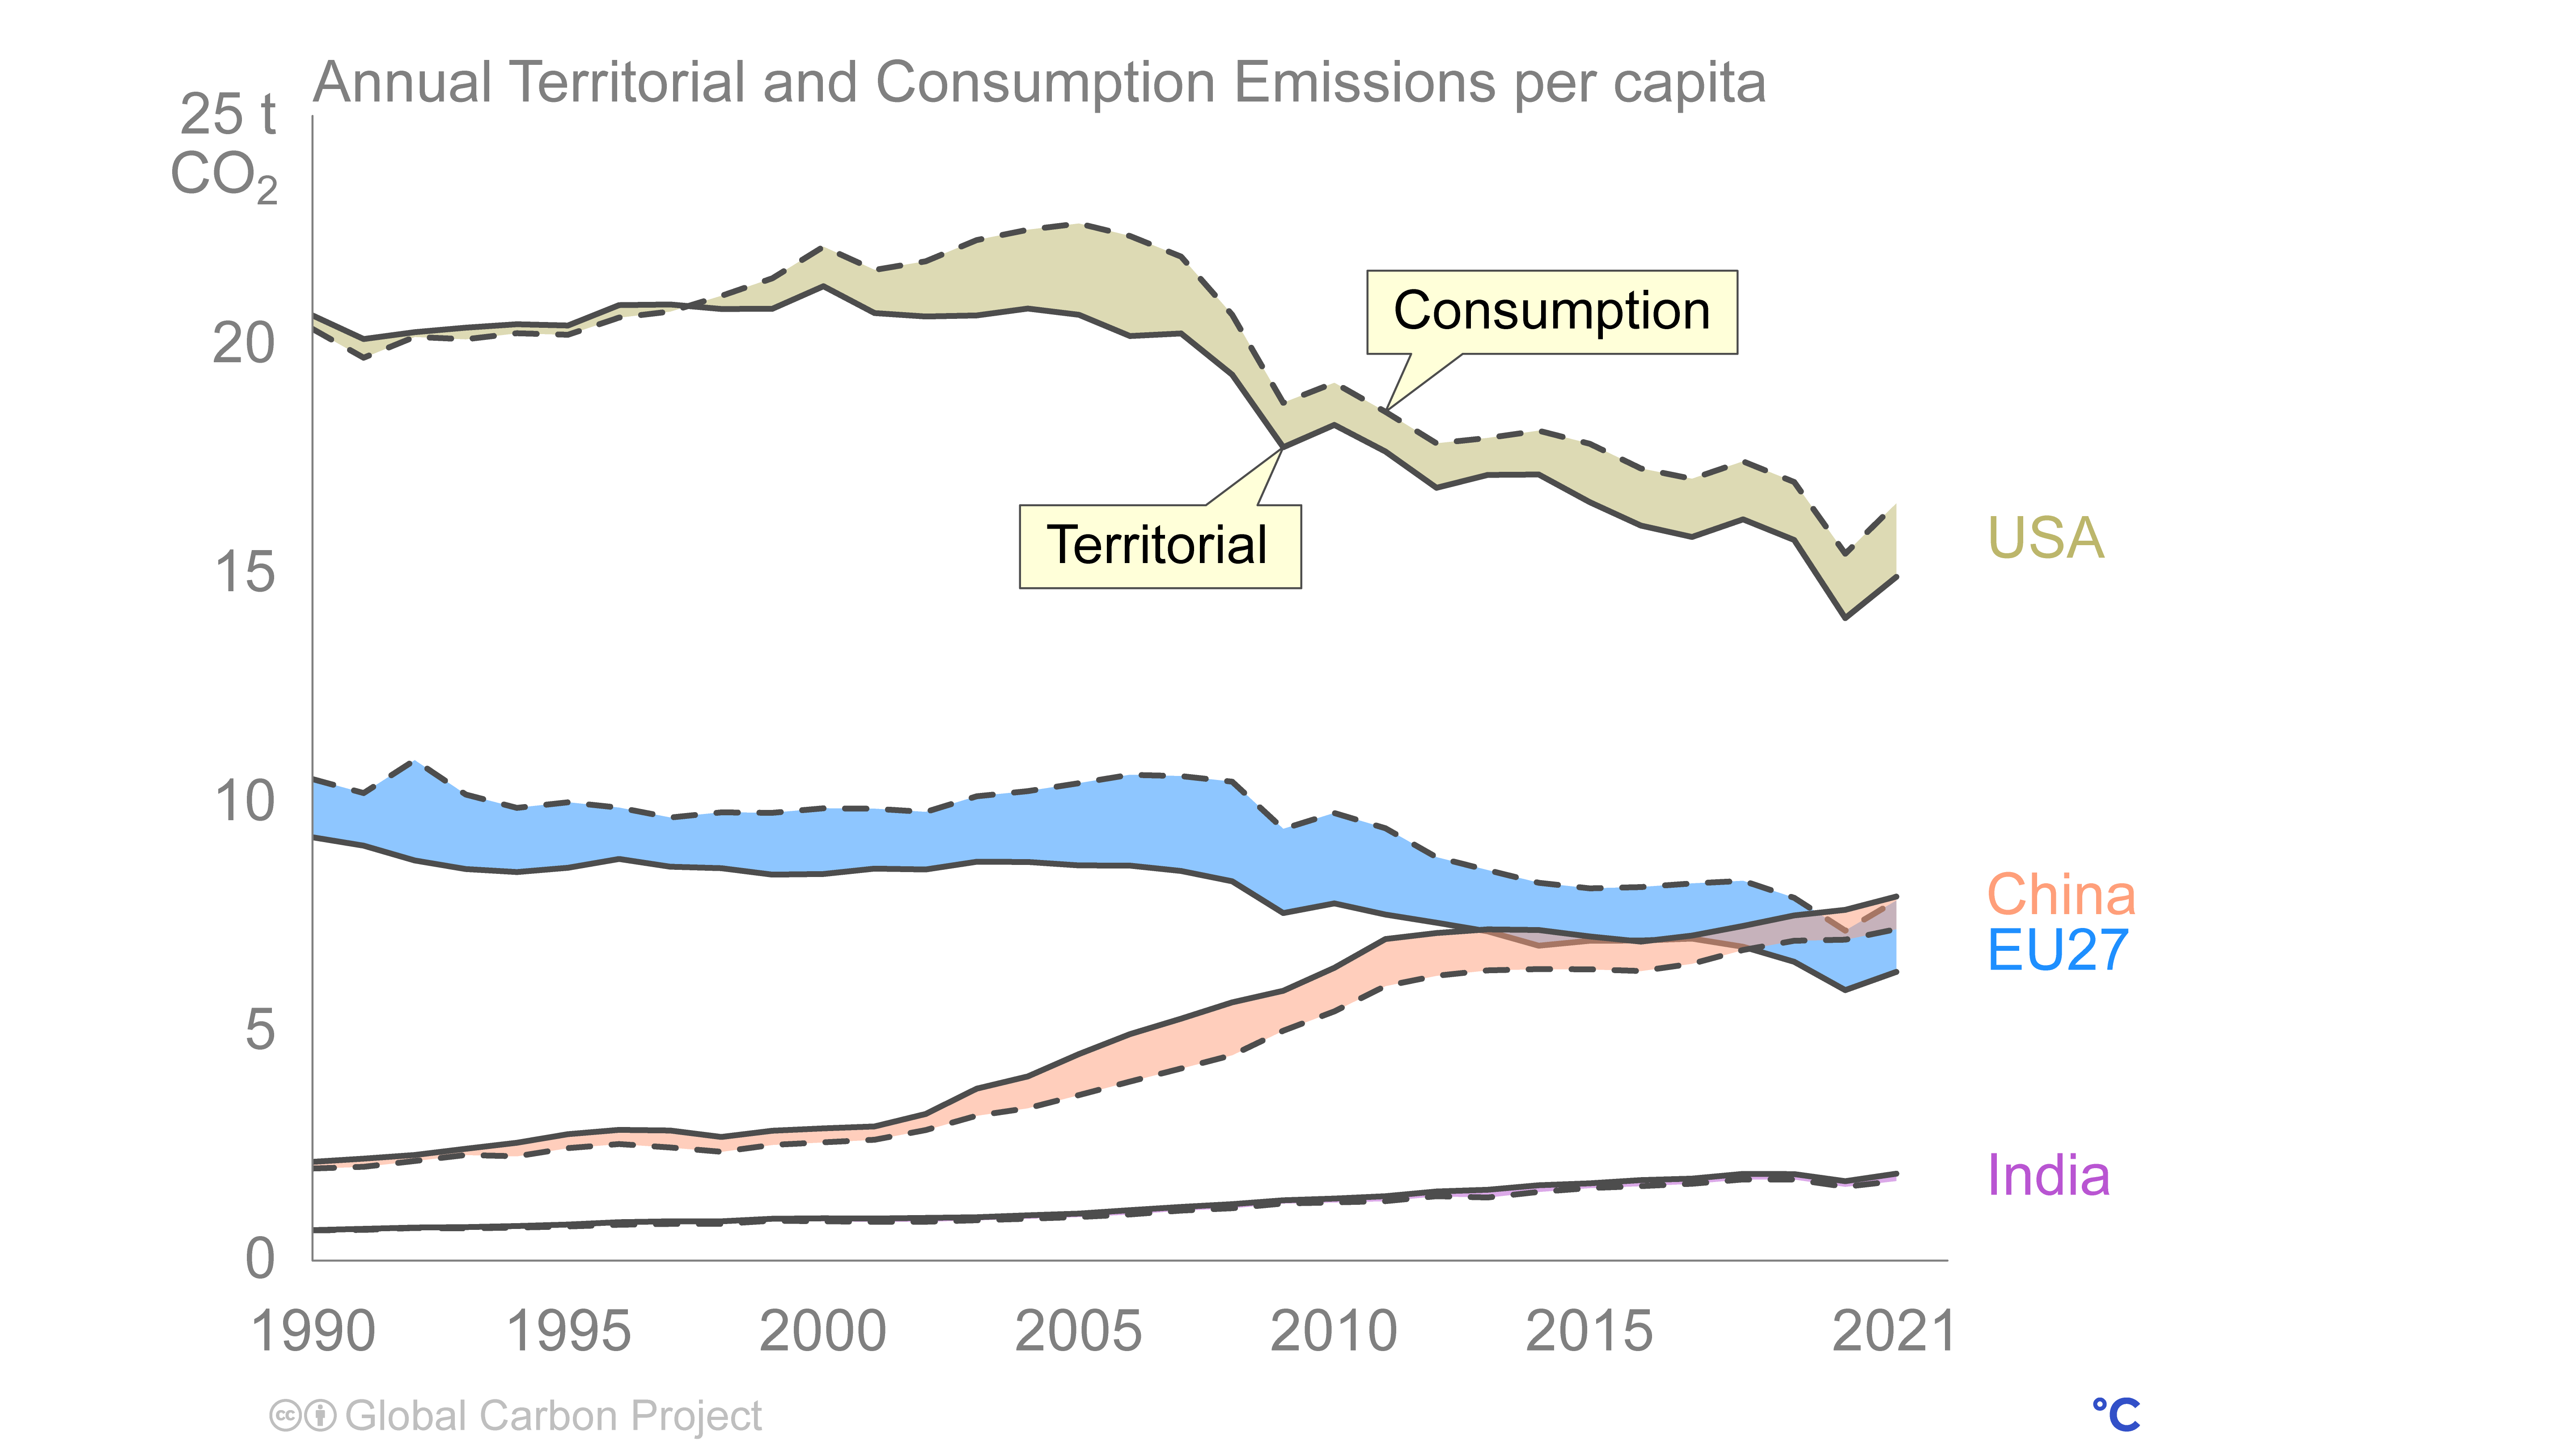
Annual Territorial and Consumption Emissions per capita

Right click to download: CSV / PNG
Annual Territorial and Consumption Emissions

Right click to download: CSV / PNG
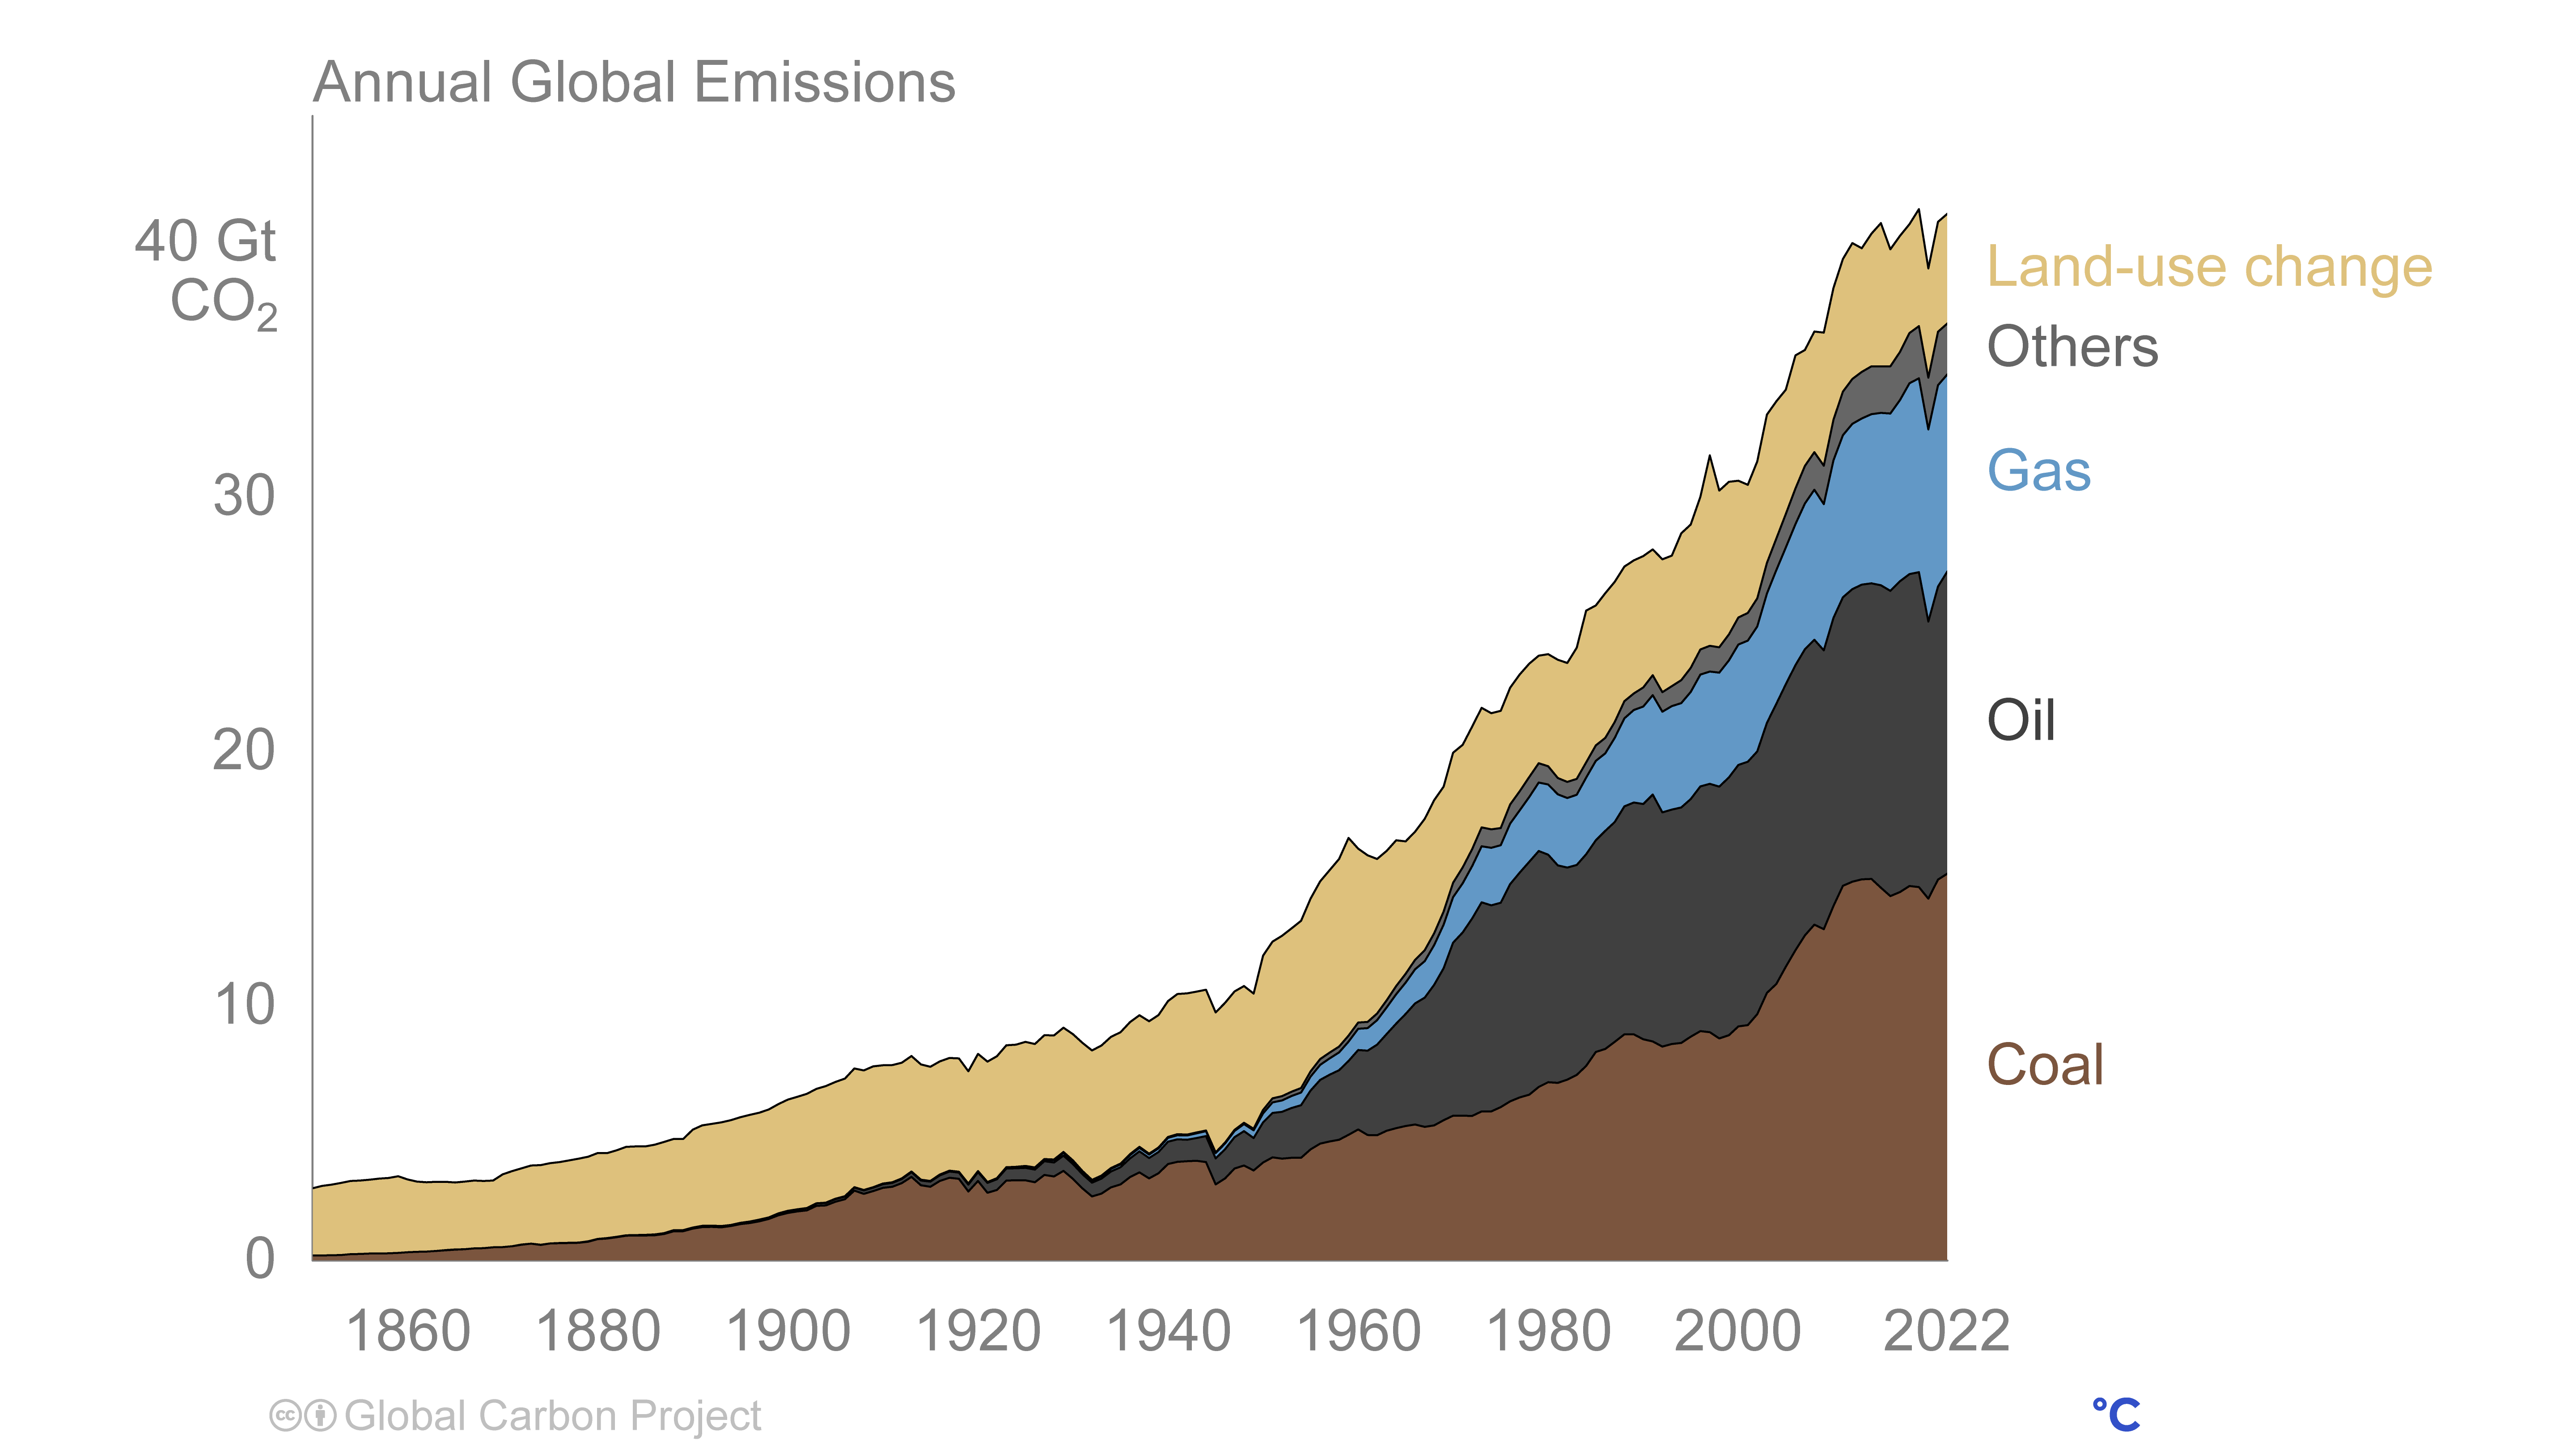
Annual Global Emissions

Right click to download: CSV / PNG
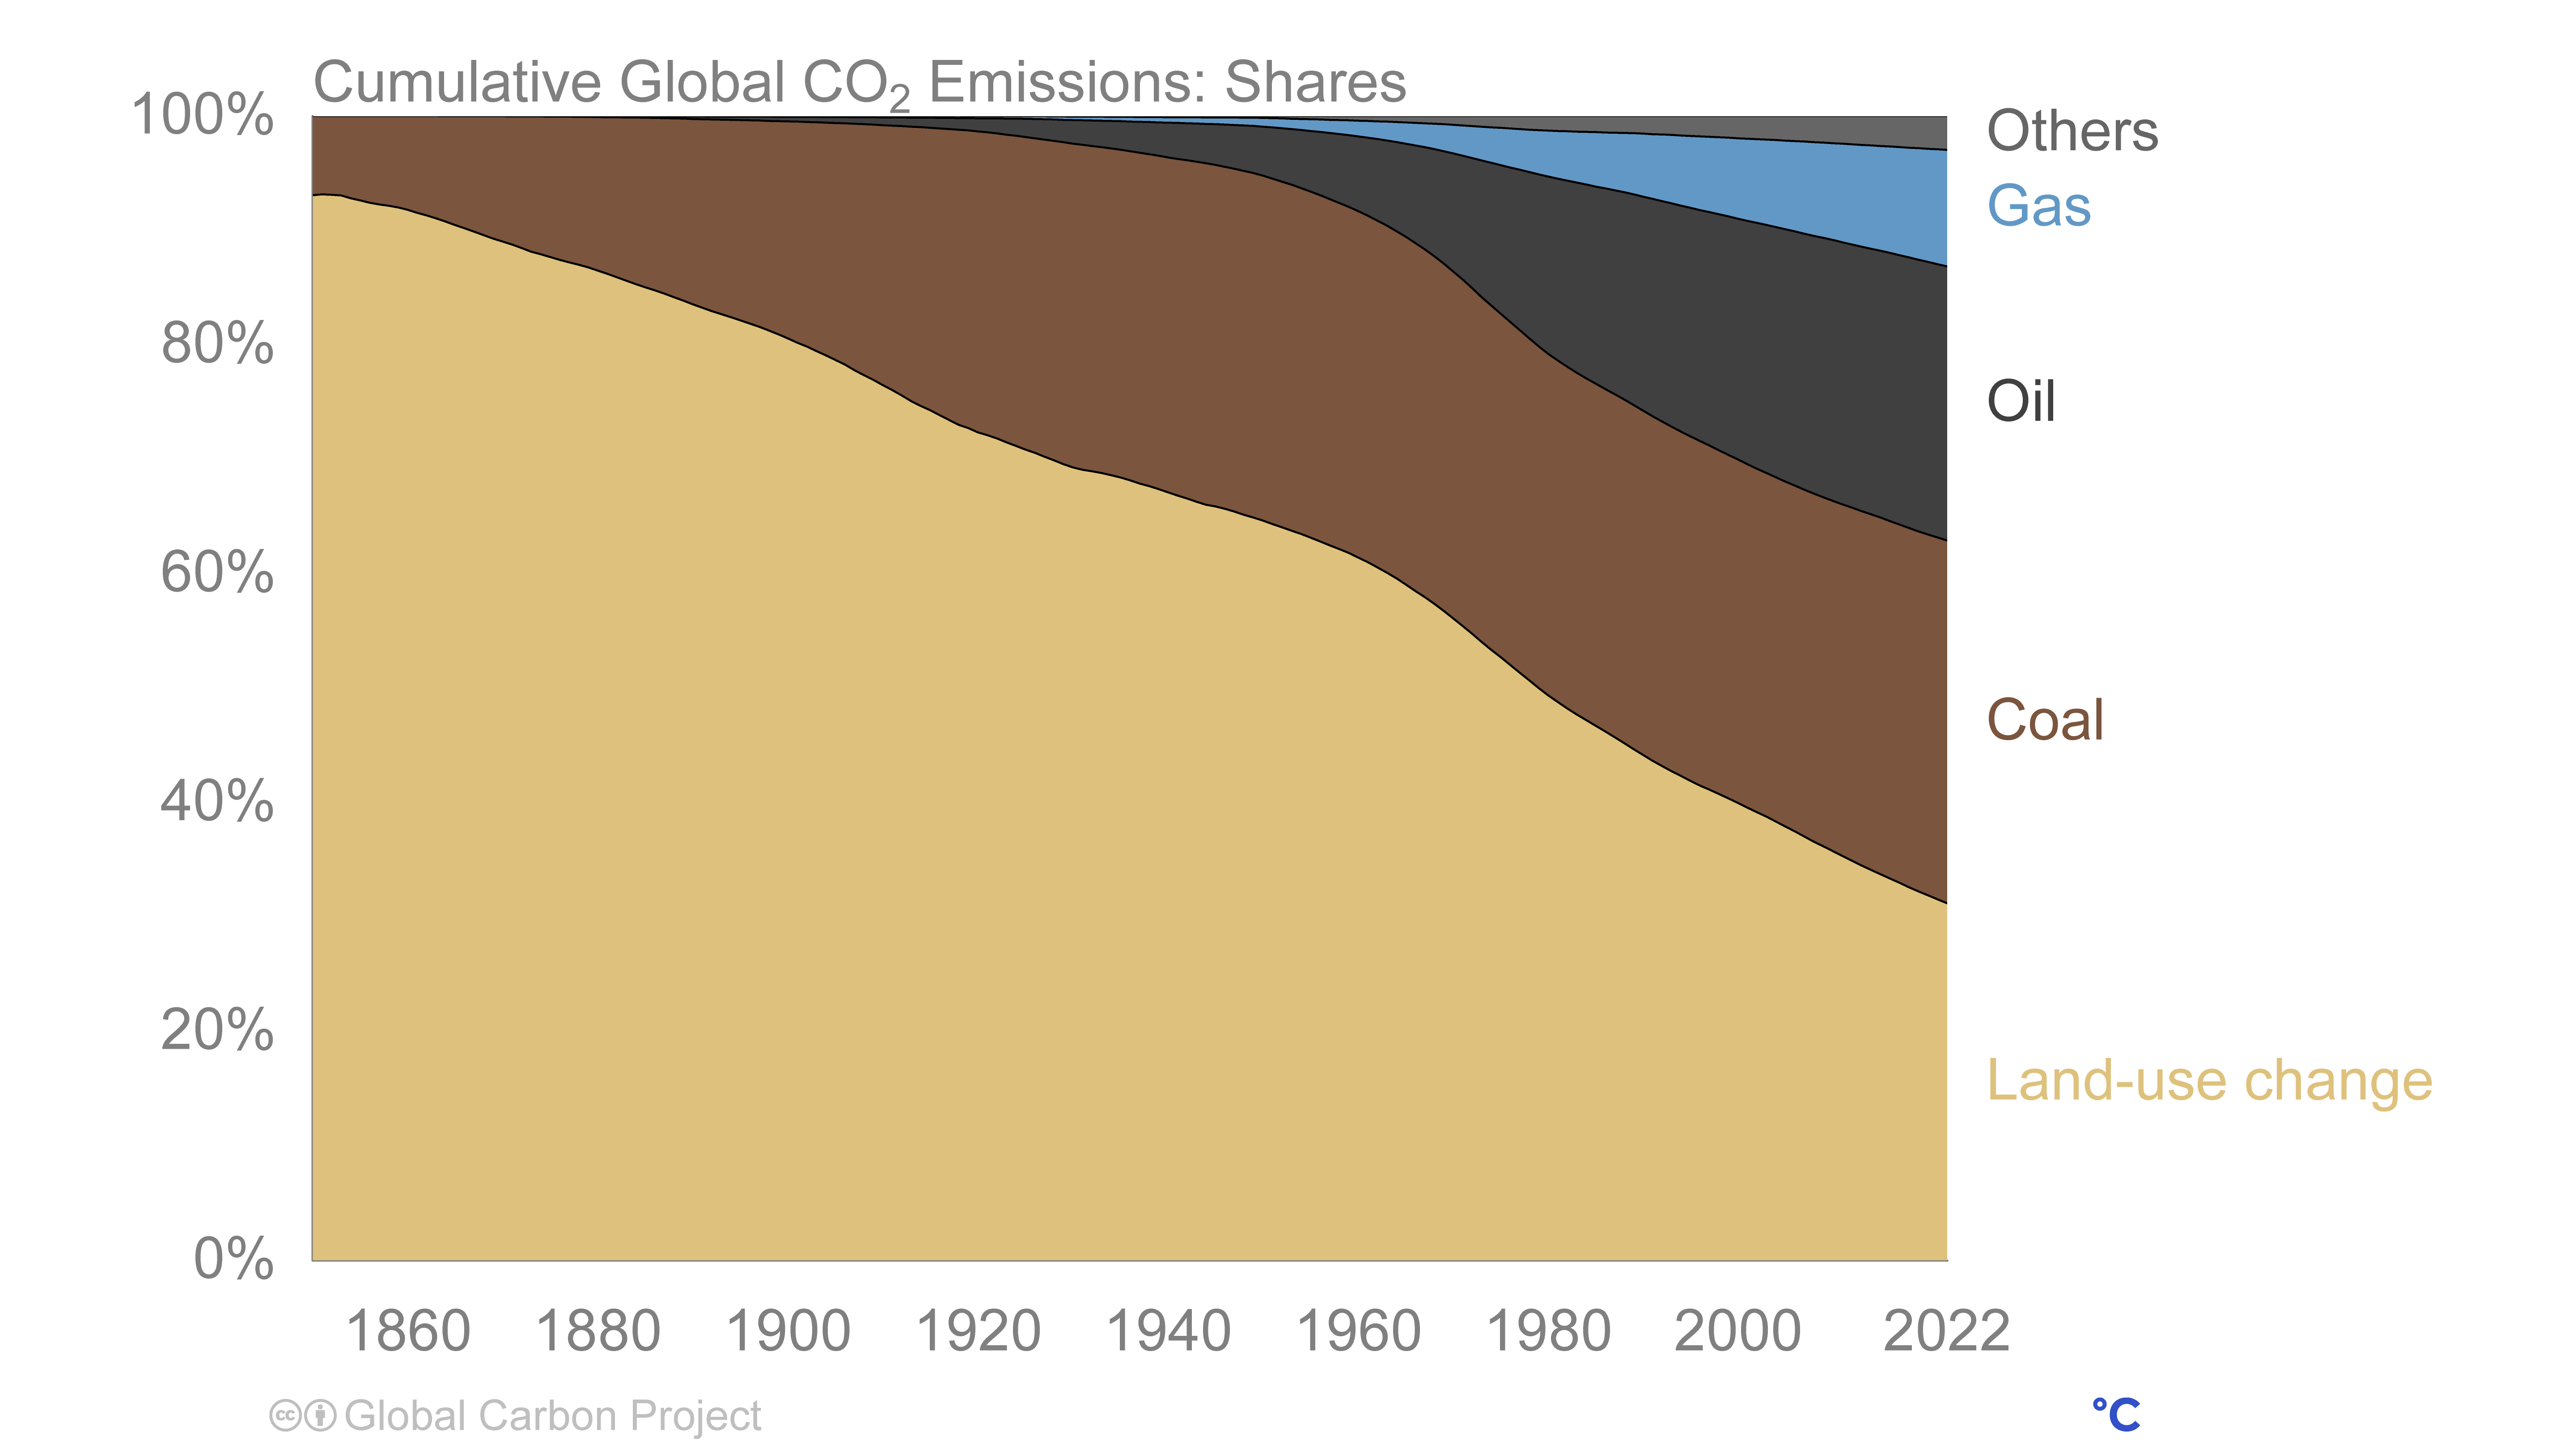
Cumulative Global co₂ Emissions: Shares

Right click to download: CSV / PNG
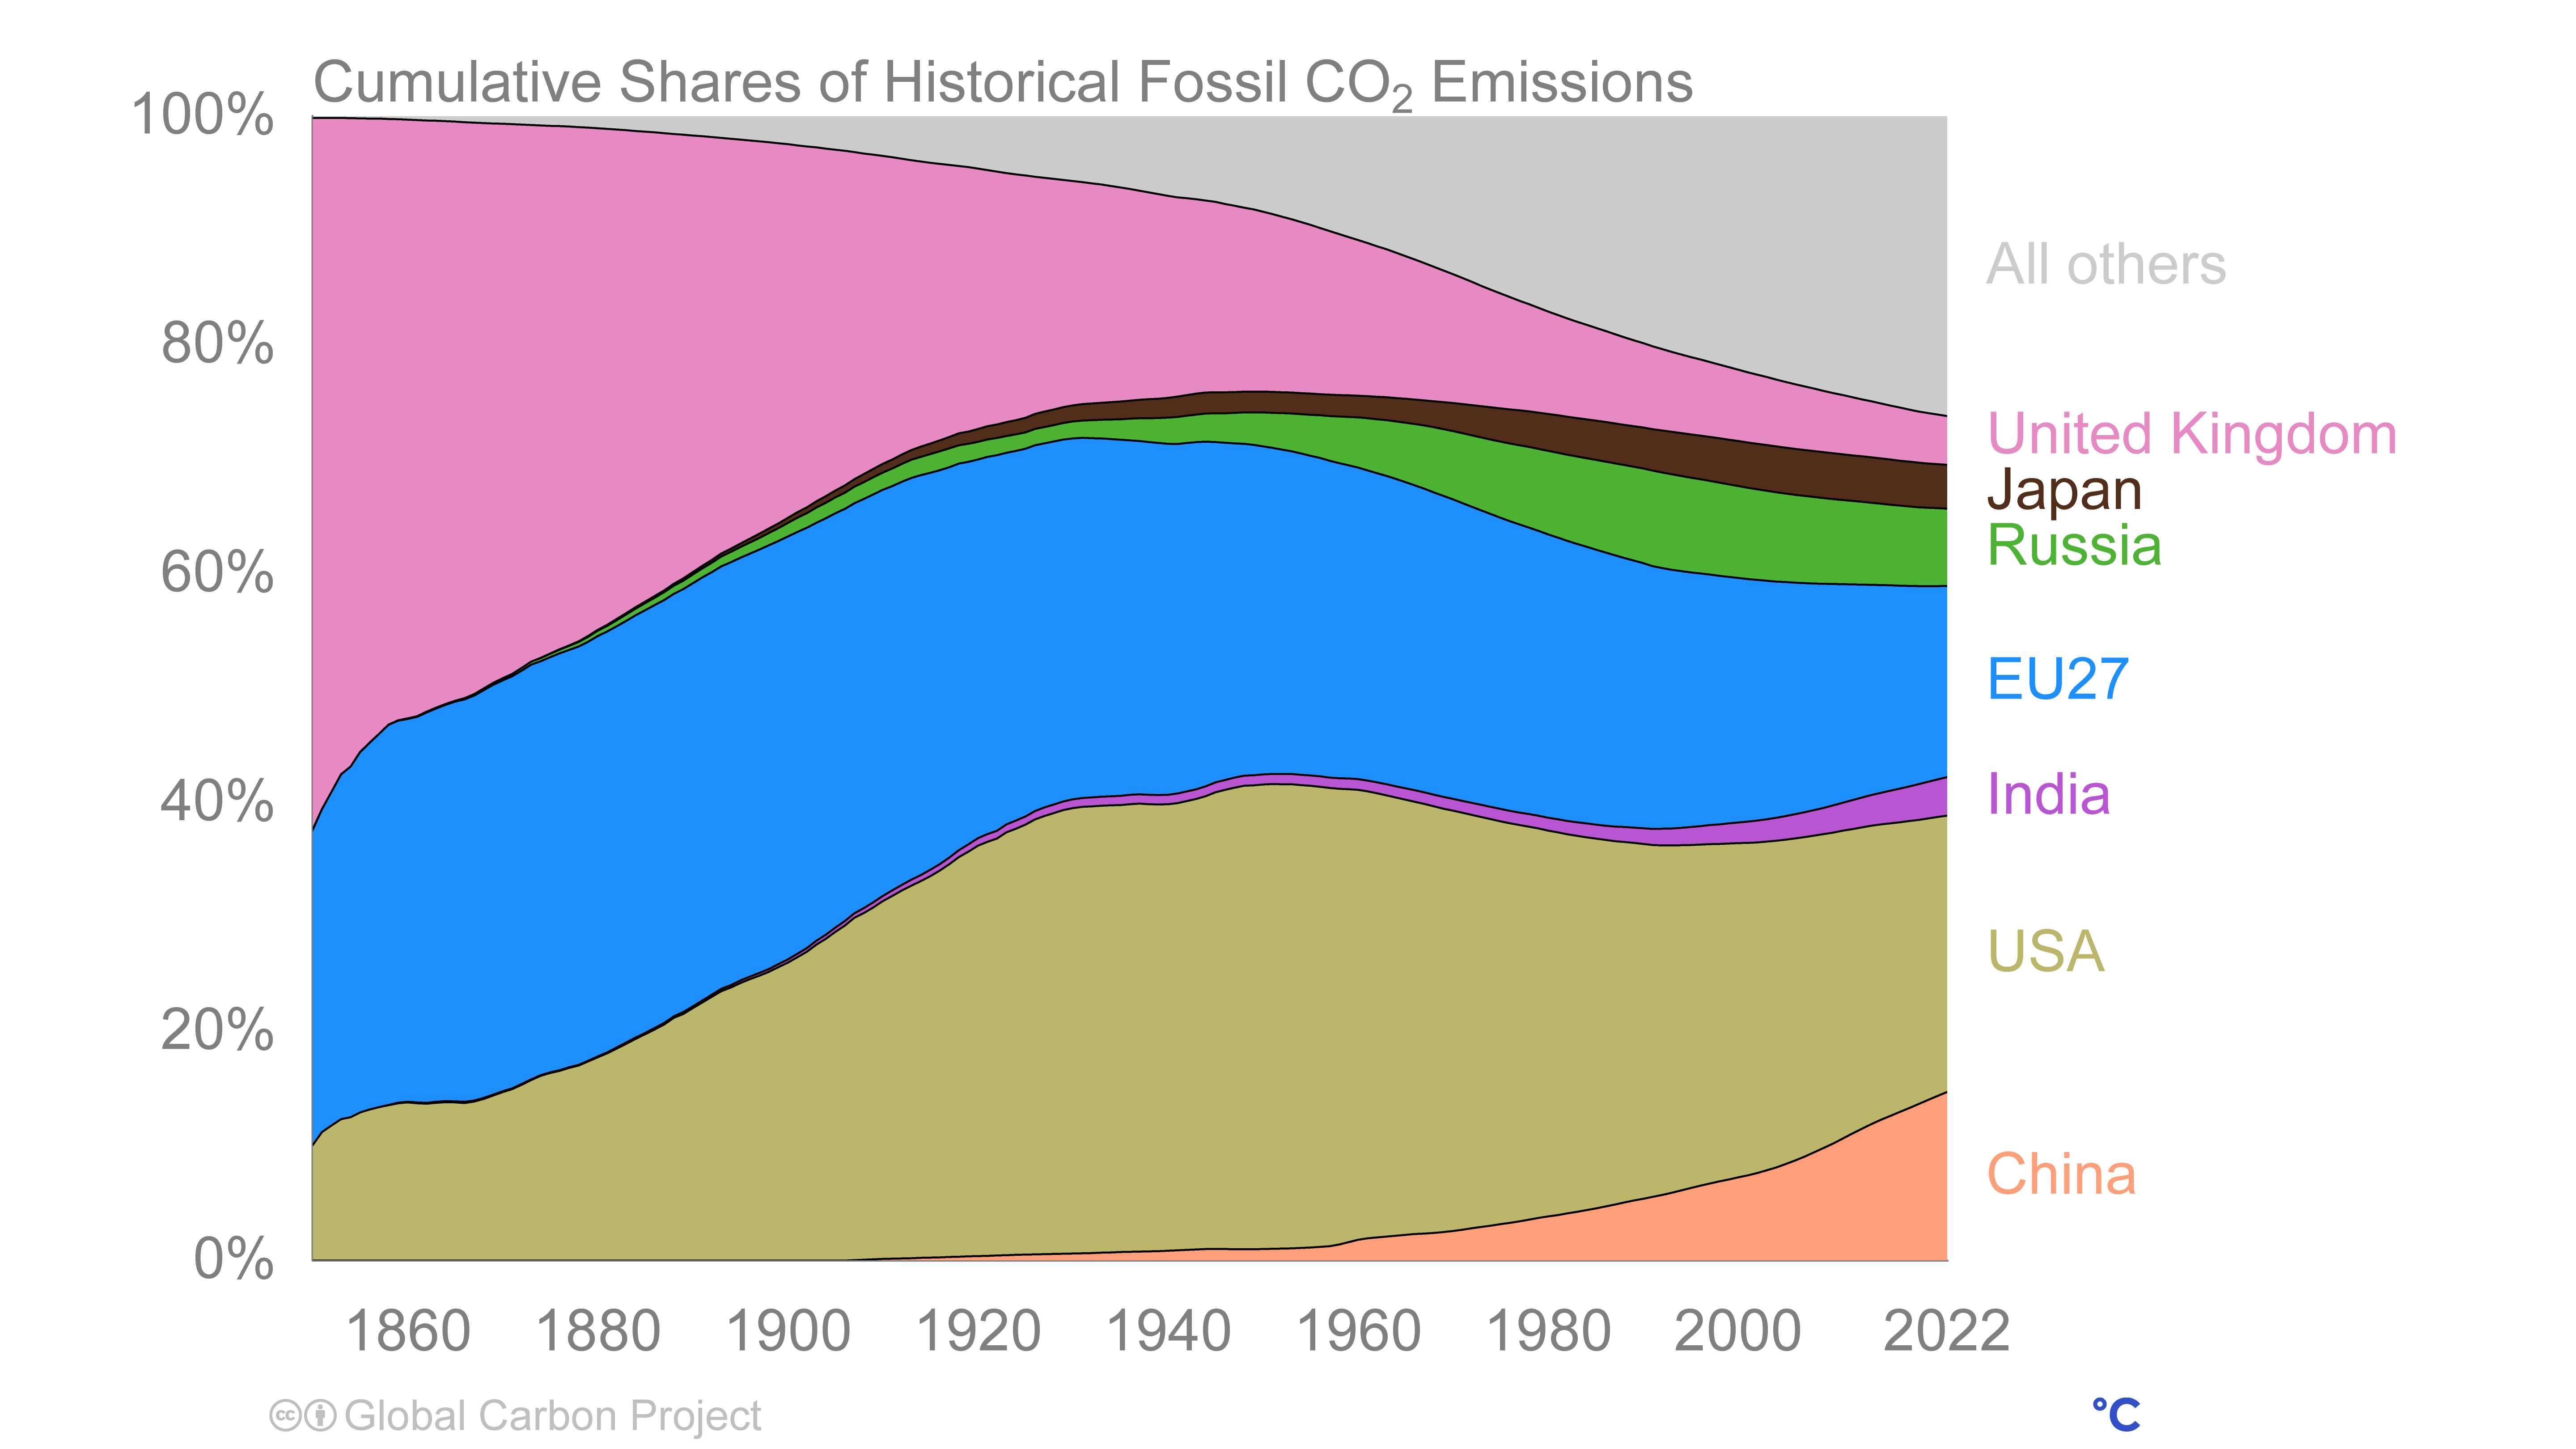
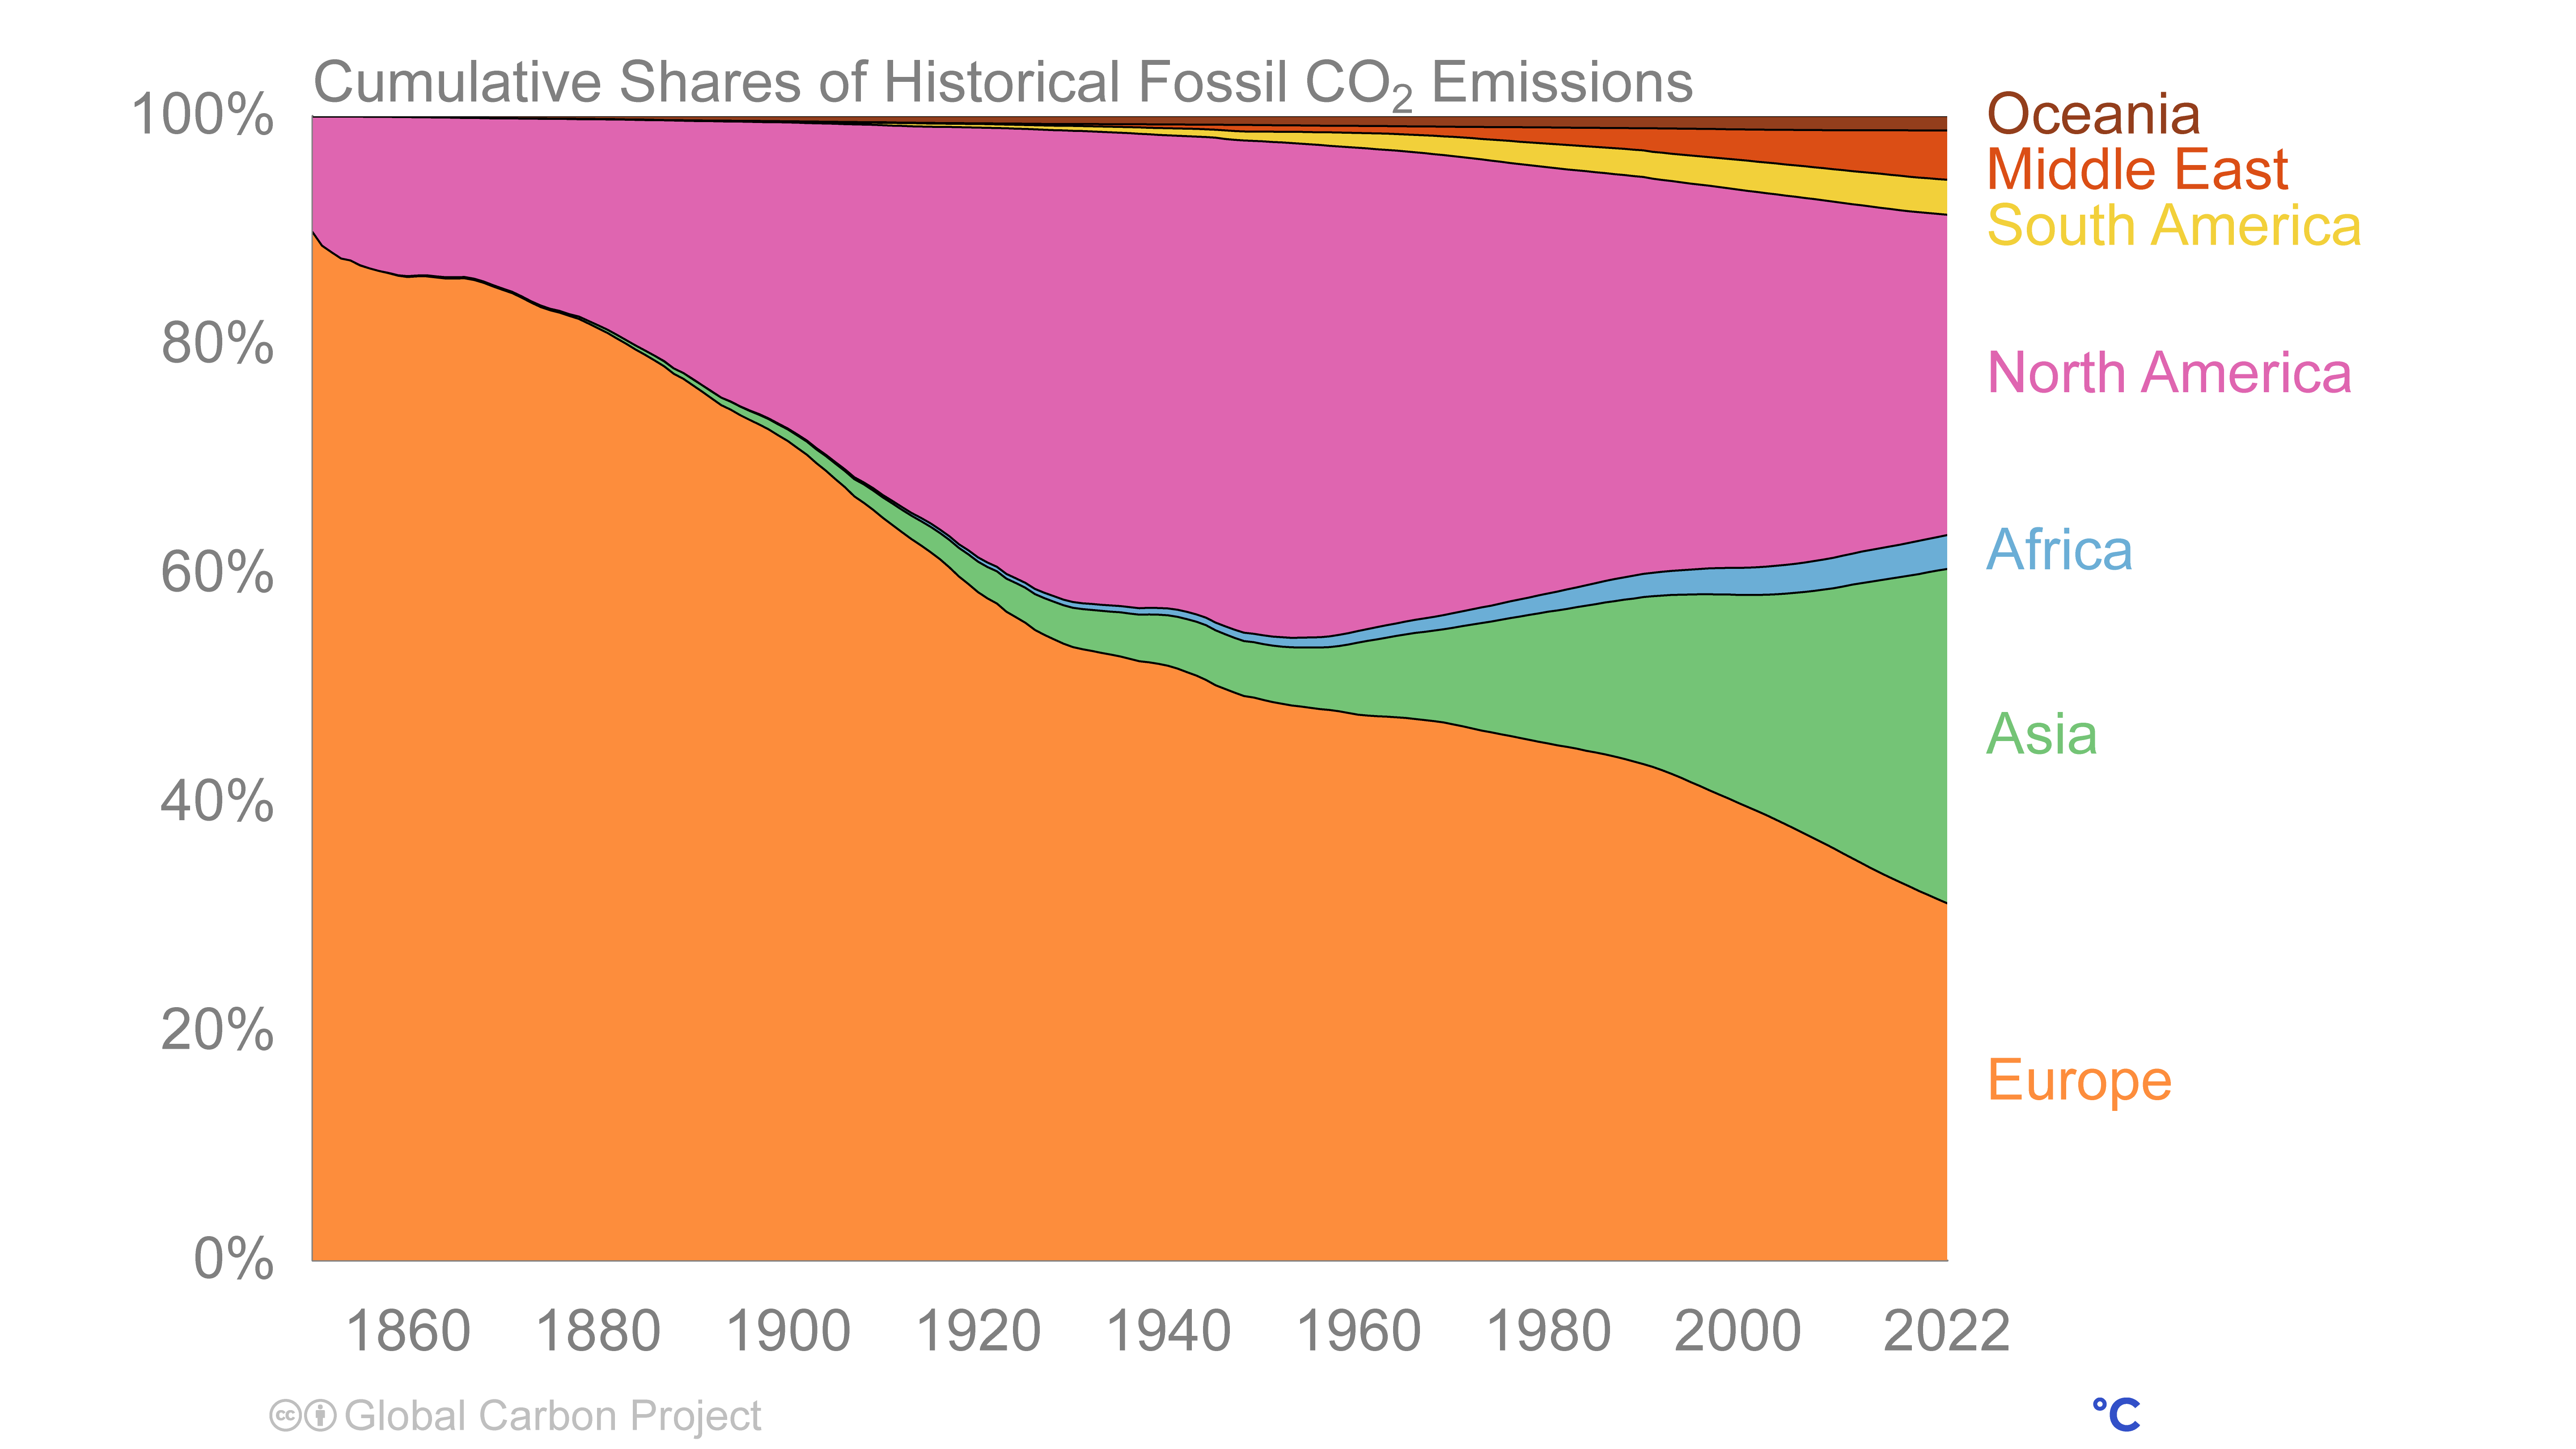
Cumulative Shares of Historical Fossil co₂ Emissions

Right click to download: CSV / PNG
Cumulative Shares of Historical Fossil co₂ Emissions

Right click to download: CSV / PNG
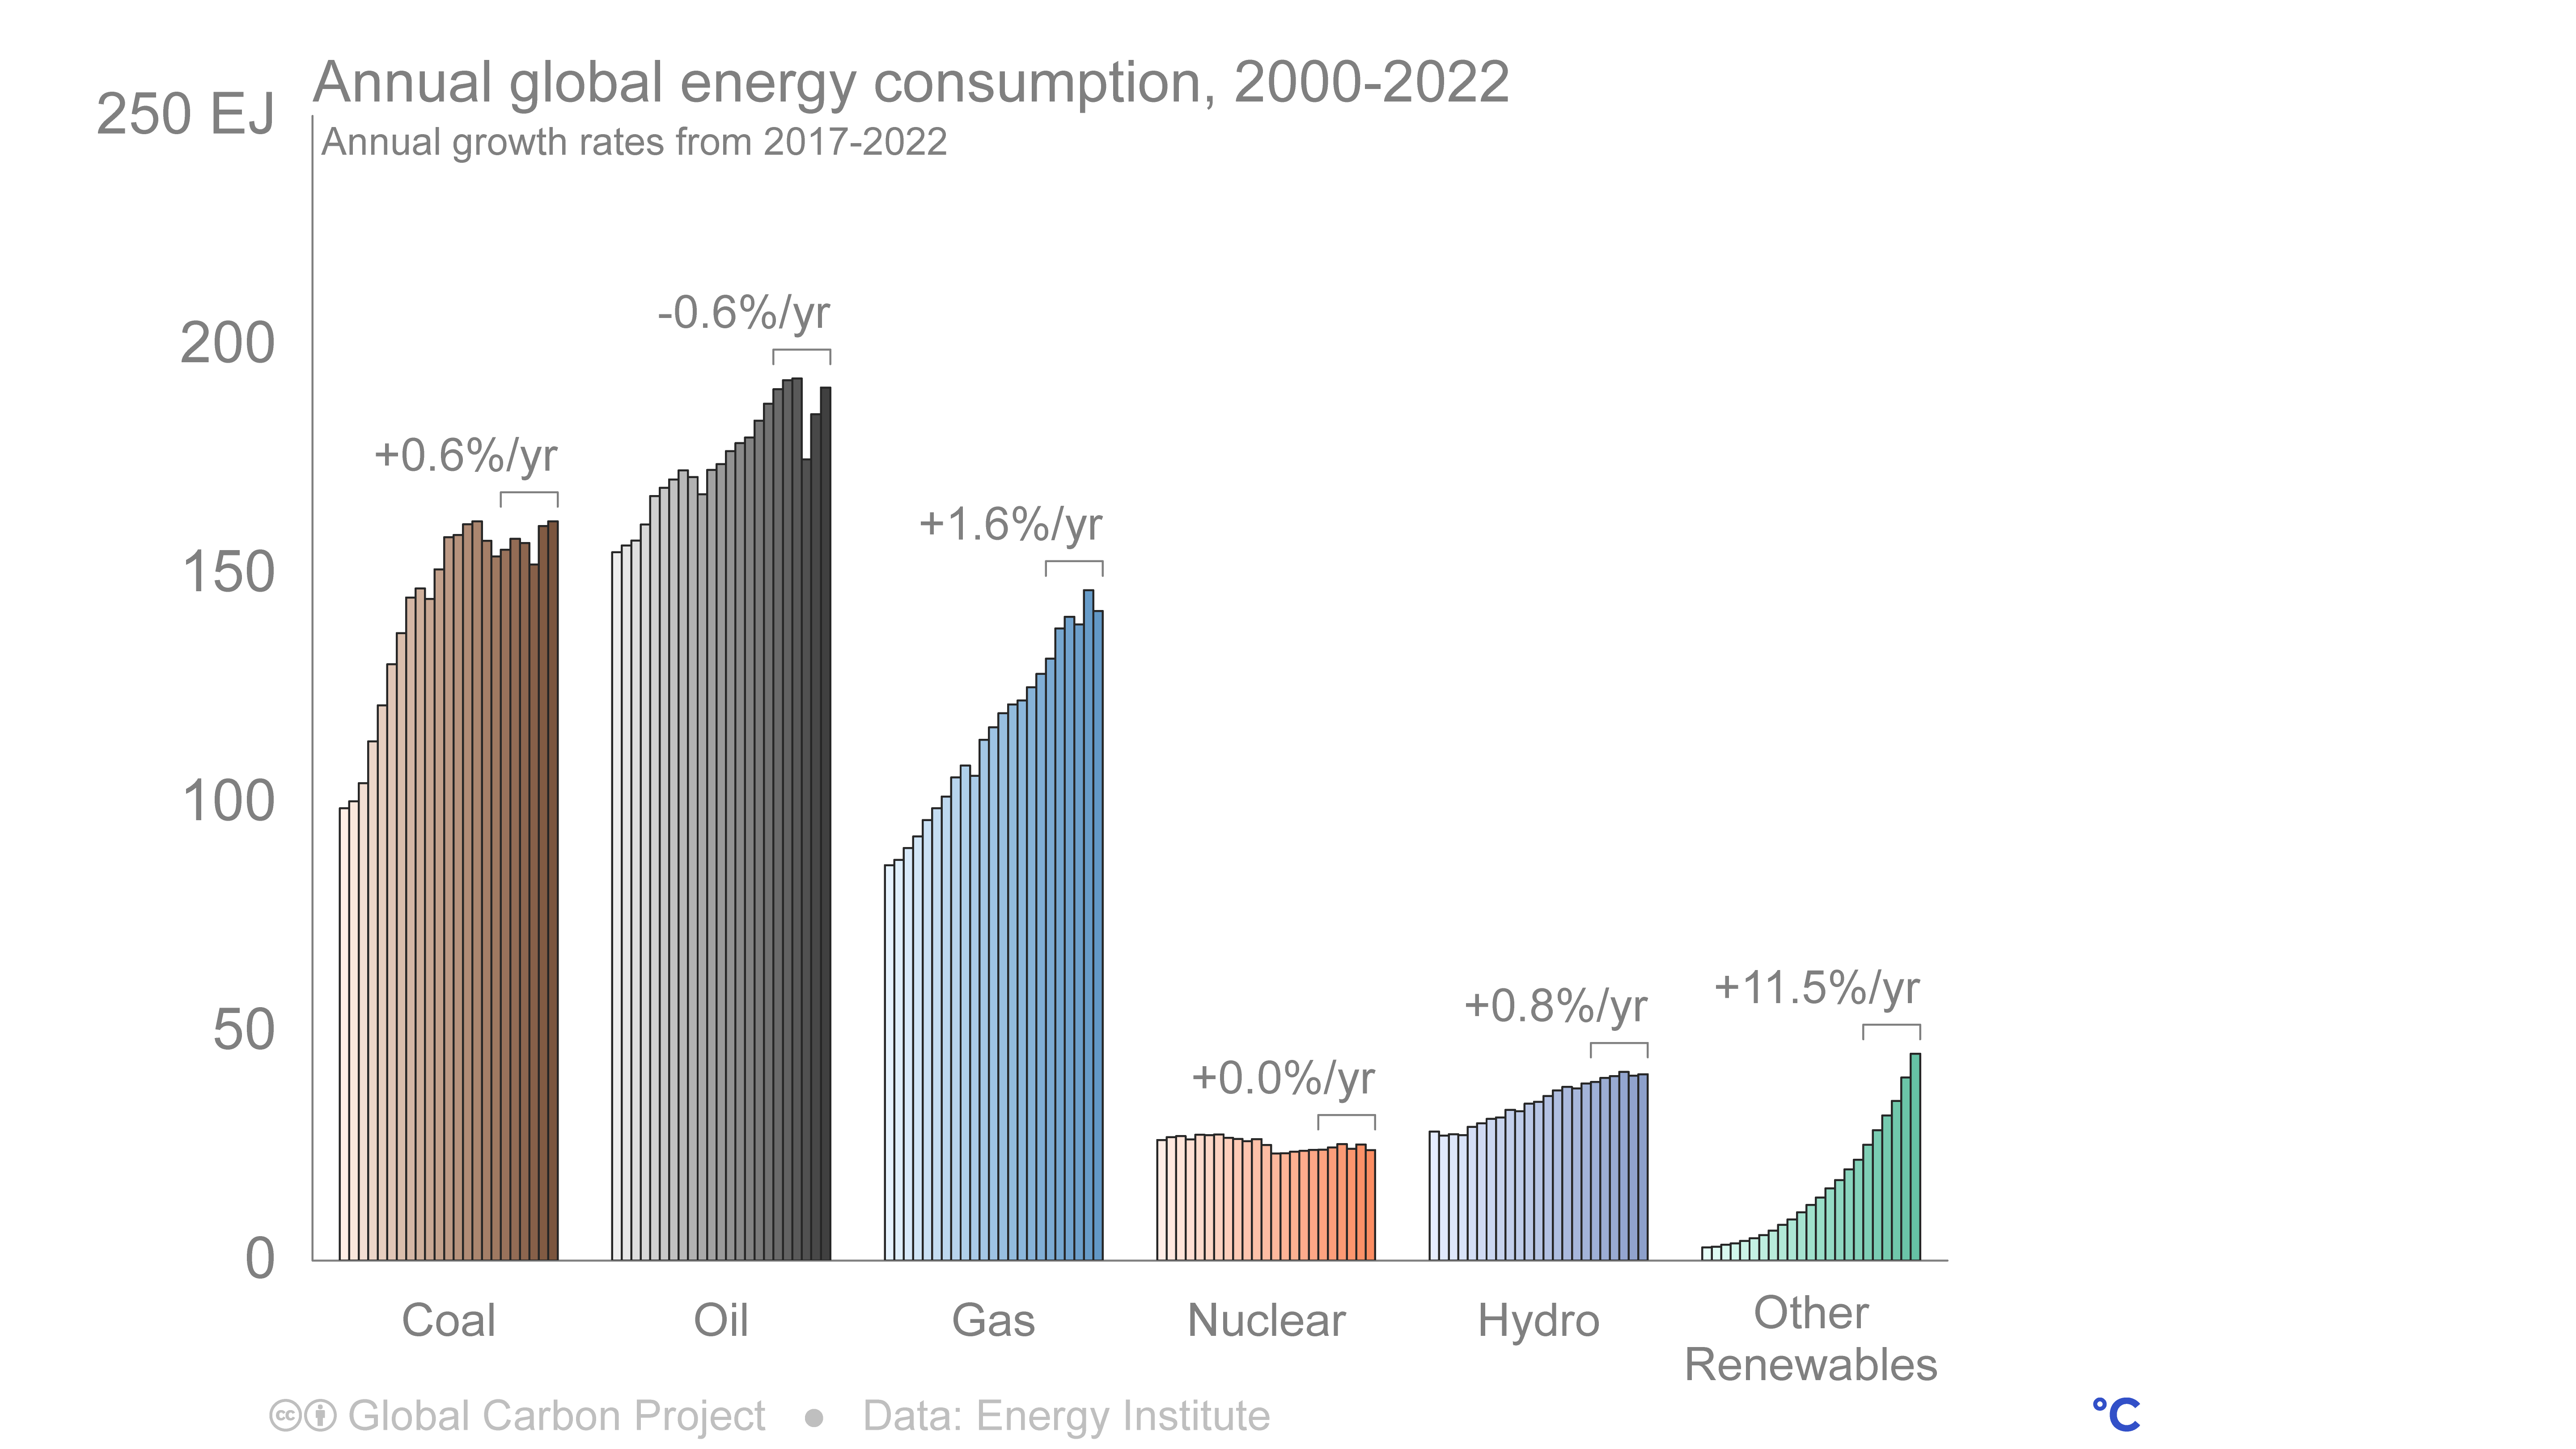
Annual global energy consumption, 2000-2022

Right click to download: CSV / PNG
Balance of sources and sinks

Right click to download: CSV


