Pdrmip Article 2: A Precipitation Driver And Response Model Intercomparison Project, Protocol And Preliminary Results
Box figure 1 from article 1
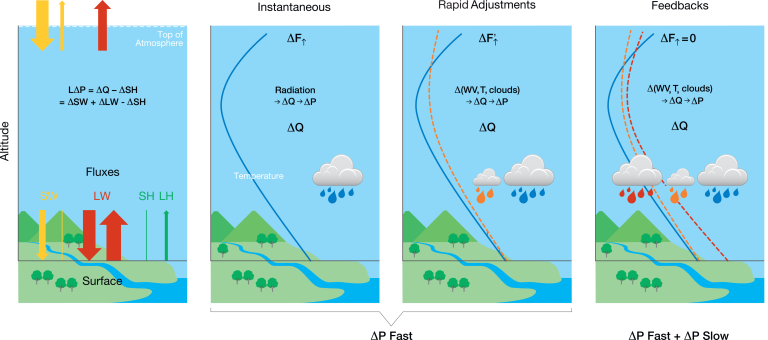
Schematic diagram of the energy fluxes and fast and slow precipiation changes (ΔP) processes.
Frame 1: At the top of the atmosphere, in the atmosphere and at the surface the energy budget is nearly in balance on a global scale. Changes in the atmospheric radiative cooling (ΔQ) can be caused by changes in absorption of shortwave radiation (SW) or changes in absorption/emission of longwave radiation (LW) or both. LH=LΔP is latent heat and SH is sensible heat.
Frame 2: An external driver of climate change alters the radiative fluxes at the top of the atmosphere and this may alter the atmospheric absorption.
Frame 3: The instantaneous change through radiation may further alter the atmospheric temperature, water vapor and clouds, through rapid adjustments. These rapid adjustments may lead to decrease or increase in clouds and water vapor and can vary through the atmosphere. The instantaneous radiative perturbation and rapid adjustments changes precipitation on a fast time scale (days to few years).
Frame 4: Climate feedback processes through changes in the surface temperature further alter the atmospheric absorption which 29 occurs on a long time scales (decades). Net radiative fluxes at the top of the atmosphere is given as F, water vapor as WV, temperature as T, and latent heat of vaporization L. In Frames 2 to 4, blue indicates the unperturbed state, orange represents the rapid adjustments and red represents the effect of both fast and slow adjustments.
G. Myhre, P. M. Forster, B. H. Samset, Ø. Hodnebrog, J. Sillmann, S. G. Aalbergsjø, T. Andrews, O. Boucher, G. Faluvegi, D. Fläschner, T. Iversen, M. Kasoar, V. Kharin, A. Kirkevåg, J.-F. Lamarque, D. Olivié, T. Richardson, D. Shindell, K. P. Shine, Camilla W. Stjern, T. Takemura, A. Voulgarakis, F. Zwiers
Bull. Amer. Meteor. Soc., doi: 10.1175/BAMS-D-16-0019.1, 2016
Figure 1 from article 1
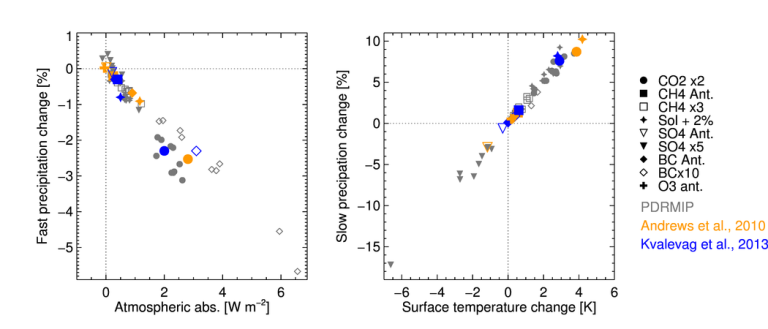
Fast and slow global precipitation response as a function of atmospheric absorption and radiative forcing at the top of the atmosphere, respectively, from two modelling studies (Andrews et al. 2010; Kvalevåg et al. 2013) combined with PDRMIP results from Samset et al. (2016) as well as PDRMIP results from the IPSL-CM5A model. Ant in the legend denotes anthropogenic changes.
G. Myhre, P. M. Forster, B. H. Samset, Ø. Hodnebrog, J. Sillmann, S. G. Aalbergsjø, T. Andrews, O. Boucher, G. Faluvegi, D. Fläschner, T. Iversen, M. Kasoar, V. Kharin, A. Kirkevåg, J.-F. Lamarque, D. Olivié, T. Richardson, D. Shindell, K. P. Shine, Camilla W. Stjern, T. Takemura, A. Voulgarakis, F. Zwiers
Bull. Amer. Meteor. Soc., doi: 10.1175/BAMS-D-16-0019.1, 2016
Figure 2 from article 1
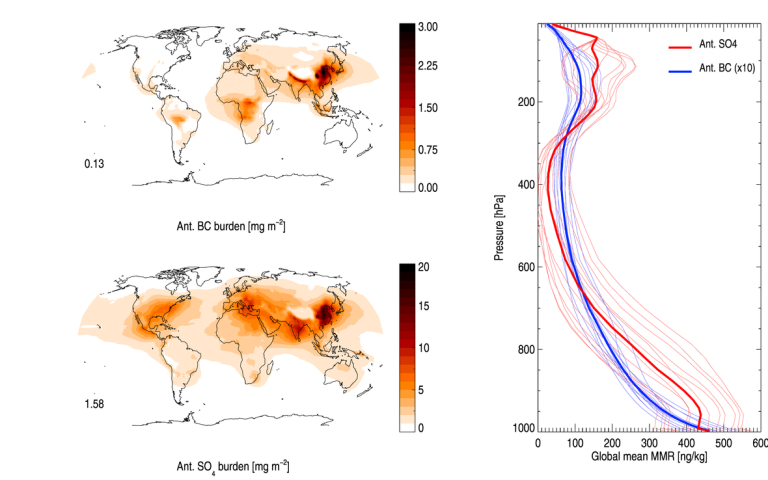
PDRMIP prescribed anthropogenic burden and aerosol mass mixing ratio (MMR) fields, constructed from AeroCom Phase II models (Myhre et al. 2013b). The two left hand panels show the geographical distribution of the annual mean burden for BC (top) and SO4 (bottom) and (right hand panel) the vertical profile of MMR, of the present day increase in aerosol levels due to anthropogenic emissions. Thick lines show the annual means, thin lines show individual months for the vertical profiles. Note that BC MMR has been scaled by 10x for clarity.
G. Myhre, P. M. Forster, B. H. Samset, Ø. Hodnebrog, J. Sillmann, S. G. Aalbergsjø, T. Andrews, O. Boucher, G. Faluvegi, D. Fläschner, T. Iversen, M. Kasoar, V. Kharin, A. Kirkevåg, J.-F. Lamarque, D. Olivié, T. Richardson, D. Shindell, K. P. Shine, Camilla W. Stjern, T. Takemura, A. Voulgarakis, F. Zwiers
Bull. Amer. Meteor. Soc., doi: 10.1175/BAMS-D-16-0019.1, 2016
Figure 3 from article 1
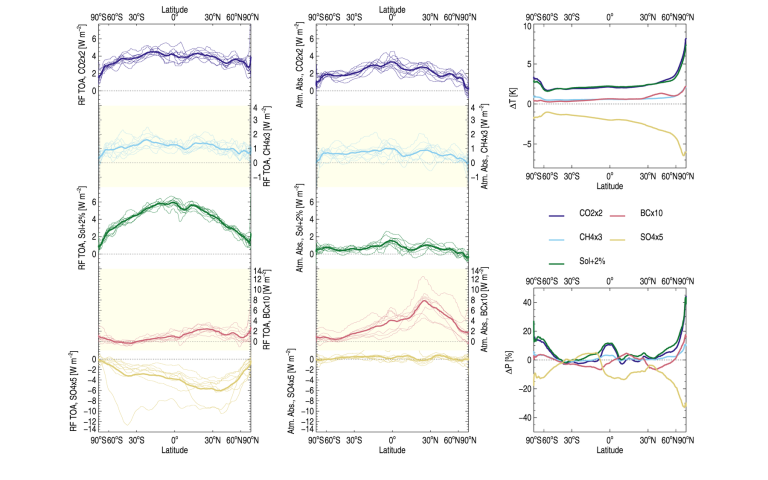
Zonal and annual mean radiative forcing, atmospheric absorption, surface temperature change, and precipitation change for the five PDRMIP drivers.
The left hand panel shows the zonal-annual mean top-of-atmosphere radiative forcing for the five PDRMIP drivers (from top bottom: CO2 in blue, CH4 in cyan, solar in green, BC in red and SO4 in yellow); the individual models are shown (thin lines), in addition to the multi-model mean 737 (thick lines).
The middle panel shows the same but for atmospheric absorption.
The right hand panels show the surface temperature (top) and precipitation changes (bottom) for the multi-model mean for all five drivers (following the color coding from the left and centre panels). Radiative forcing and atmospheric absorption are diagnosed from the fixed-SST simulations.
G. Myhre, P. M. Forster, B. H. Samset, Ø. Hodnebrog, J. Sillmann, S. G. Aalbergsjø, T. Andrews, O. Boucher, G. Faluvegi, D. Fläschner, T. Iversen, M. Kasoar, V. Kharin, A. Kirkevåg, J.-F. Lamarque, D. Olivié, T. Richardson, D. Shindell, K. P. Shine, Camilla W. Stjern, T. Takemura, A. Voulgarakis, F. Zwiers
Bull. Amer. Meteor. Soc., doi: 10.1175/BAMS-D-16-0019.1, 2016
Figure 4 from article 1
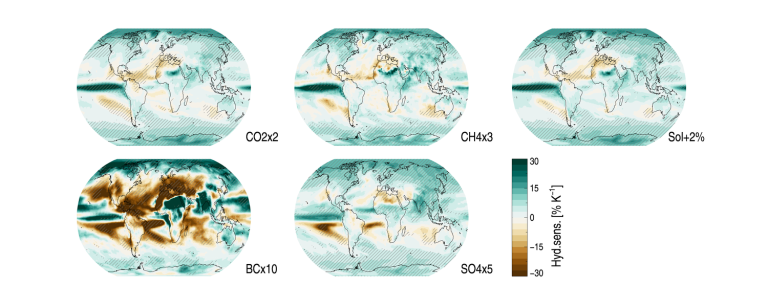
Geographical distribution of multi-model mean apparent HS parameter for the five PDRMIP drivers experiments (CO2x2, CH4x3, Solar+2%, BCx10, SO4x5). The apparent HS is calculated as annual mean geographical precipitation change divided by global and annual mean temperature change relative to the base simulation. The hatching is included where the mean apparent HS over the 50 years period is more than one standard deviation away from zero.
G. Myhre, P. M. Forster, B. H. Samset, Ø. Hodnebrog, J. Sillmann, S. G. Aalbergsjø, T. Andrews, O. Boucher, G. Faluvegi, D. Fläschner, T. Iversen, M. Kasoar, V. Kharin, A. Kirkevåg, J.-F. Lamarque, D. Olivié, T. Richardson, D. Shindell, K. P. Shine, Camilla W. Stjern, T. Takemura, A. Voulgarakis, F. Zwiers
Bull. Amer. Meteor. Soc., doi: 10.1175/BAMS-D-16-0019.1, 2016
Figure 5 from article 1
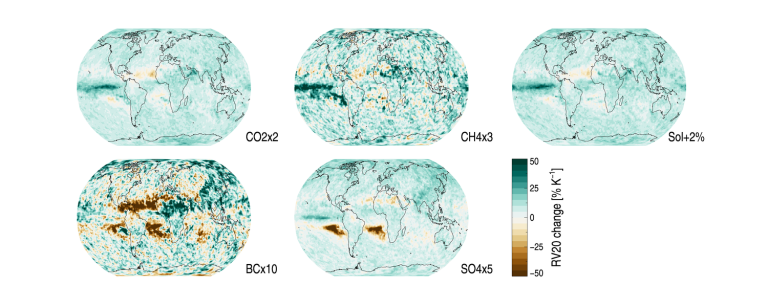
Geographical distribution of multi-model mean changes in 20-year return values of annual maximum daily precipitation per unit of global warming for the five PDRMIP driver experiments (CO2x2, CH4x3, Solar+2%, BCx10, SO4x5). The change in 20-year return values is given as percentage change divided by global and annual mean temperature change relative to the base simulation.
G. Myhre, P. M. Forster, B. H. Samset, Ø. Hodnebrog, J. Sillmann, S. G. Aalbergsjø, T. Andrews, O. Boucher, G. Faluvegi, D. Fläschner, T. Iversen, M. Kasoar, V. Kharin, A. Kirkevåg, J.-F. Lamarque, D. Olivié, T. Richardson, D. Shindell, K. P. Shine, Camilla W. Stjern, T. Takemura, A. Voulgarakis, F. Zwiers
Bull. Amer. Meteor. Soc., doi: 10.1175/BAMS-D-16-0019.1, 2016