Pdrmip Article 2: Fast And Slow Precipitation Responses To Individual Climate Forcers: A Pdrmip Multimodel Study
Alternative version of figure 1 from article 2 (with additional model in comparison)
Alternative version of figure 1 from
Fast and slow precipitation responses to individual climate forcers: A PDRMIP multimodel study.
Bjørn Hallvard Samset, Gunnar Myhre, Piers M. Forster, Øivind Hodnebrog, Timothy Andrews, Gregory S. Faluvegi, Dagmar Fläschner, Matthew Kasoar, Viatcheslav V. Kharin, Alf Kirkevåg, Jean-François Lamarque, Dirk Jan Leo Oliviè, Thomas Benjamin Richardson, Drew T. Shindell, Keith P. Shine, Toshihiko Takemura, Apostolos Voulgarakis
Geophys. Res. Lett., 43, 2782–2791, 2016
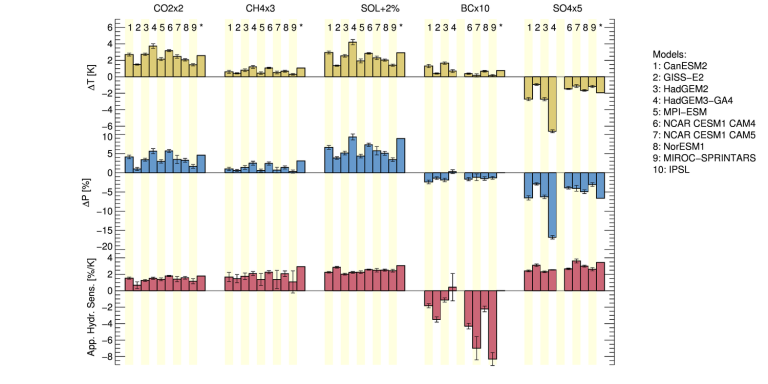
Figure caption:
Global, annual mean (top row) temperature and (middle row) precipitation change for years 51–100 following a climate perturbation and (bottom row) the resulting apparent hydrological sensitivity.
The numbers indicate the participating models. Error bars indicate ±1 standard deviation of interannual variability.
Figure 2 from article 2
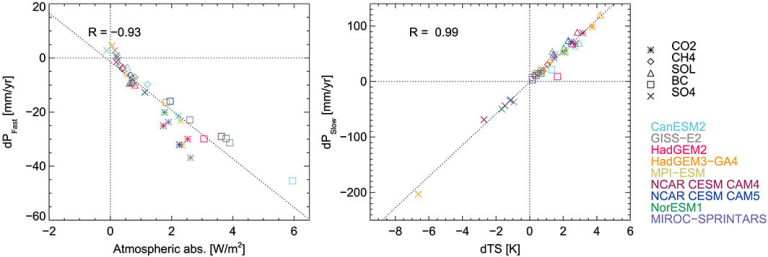
Regression of (left) fast precipitation change versus atmospheric absorption and (right) slow precipitation change versus surface temperature change.
The shown regression lines and Pearson coefficients of correlation (R) are for the combined data from all models and climate perturbations.
Fast and slow precipitation responses to individual climate forcers: A PDRMIP multimodel study
Bjørn Hallvard Samset, Gunnar Myhre, Piers M. Forster, Øivind Hodnebrog, Timothy Andrews, Gregory S. Faluvegi, Dagmar Fläschner, Matthew Kasoar, Viatcheslav V. Kharin, Alf Kirkevåg, Jean-François Lamarque, Dirk Jan Leo Oliviè, Thomas Benjamin Richardson, Drew T. Shindell, Keith P. Shine, Toshihiko Takemura, Apostolos Voulgarakis
Geophys. Res. Lett., 43, 2782–2791, 2016
Figure 3. Geographical patterns of multimodel mean precipitation change.
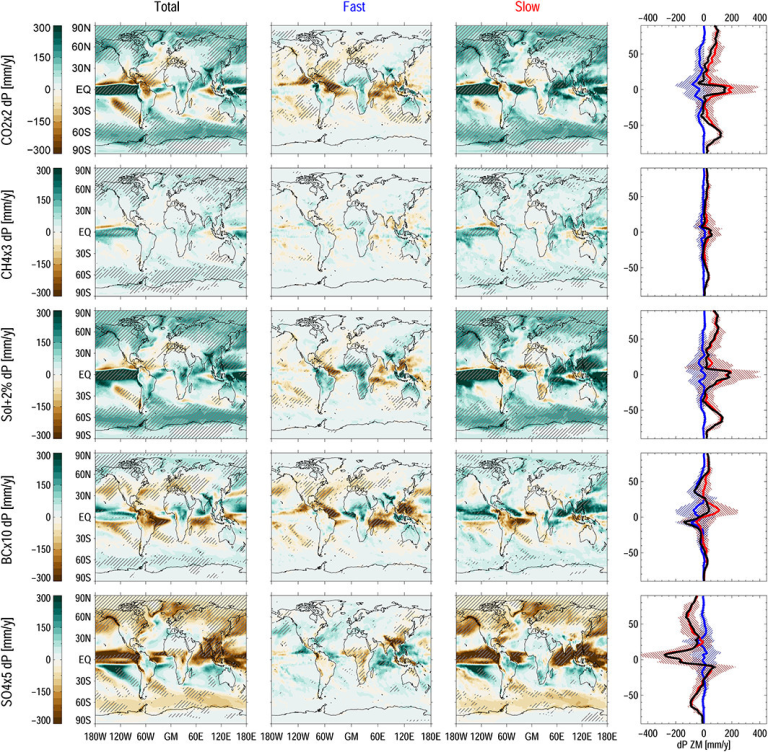
Each row shows a different climate perturbation. Hatched regions indicate where the multimodel mean is more than 1 standard deviation away from zero. (first column) Total change. (second column) Fast change due to rapid adjustments. (third column) Slow change due to surface temperature change. (fourth column) Multimodel zonal means, showing fast (blue), slow (red), and total (black) precipitation changes. The shaded bands show ±1σ of the nine-model ensemble.
Fast and slow precipitation responses to individual climate forcers: A PDRMIP multimodel study
Bjørn Hallvard Samset, Gunnar Myhre, Piers M. Forster, Øivind Hodnebrog, Timothy Andrews, Gregory S. Faluvegi, Dagmar Fläschner, Matthew Kasoar, Viatcheslav V. Kharin, Alf Kirkevåg, Jean-François Lamarque, Dirk Jan Leo Oliviè, Thomas Benjamin Richardson, Drew T. Shindell, Keith P. Shine, Toshihiko Takemura, Apostolos Voulgarakis
Geophys. Res. Lett., 43, 2782–2791, 2016
Figure 4 from article 2
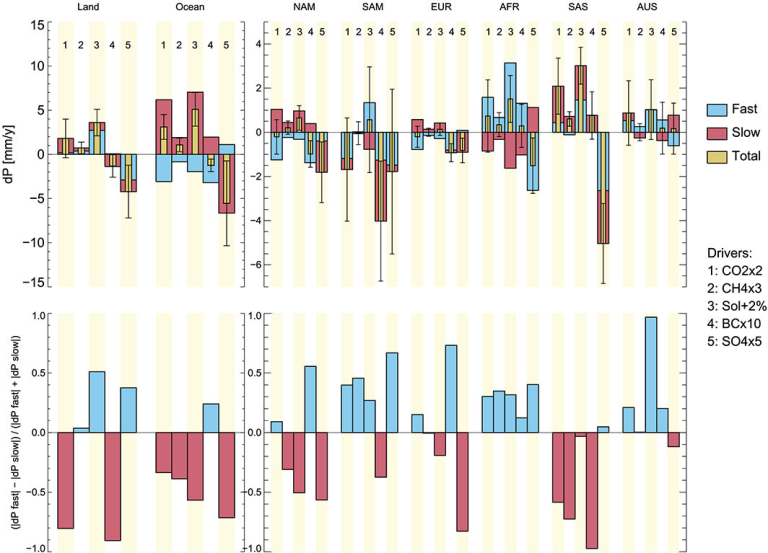
Regional precipitation response, divided into fast and slow components for five climate drivers.
(left column) Land and ocean responses. (right column) Response for the land-only regions of North America (NAM), South America (SAM), Europe (EUR), Africa (AFR), the major aerosol emission regions of South Asia (SAS), and Australia (AUS). See Figure S2 for definitions. (bottom row) Response ratio (see text), calculated from the multimodel mean values in (the top row).
Fast and slow precipitation responses to individual climate forcers: A PDRMIP multimodel study
Bjørn Hallvard Samset, Gunnar Myhre, Piers M. Forster, Øivind Hodnebrog, Timothy Andrews, Gregory S. Faluvegi, Dagmar Fläschner, Matthew Kasoar, Viatcheslav V. Kharin, Alf Kirkevåg, Jean-François Lamarque, Dirk Jan Leo Oliviè, Thomas Benjamin Richardson, Drew T. Shindell, Keith P. Shine, Toshihiko Takemura, Apostolos Voulgarakis
Geophys. Res. Lett., 43, 2782–2791, 2016