Pdrmip Article 3: Rapid Adjustments Cause Weak Surface Temperature Response To Increased Black Carbon Concentrations
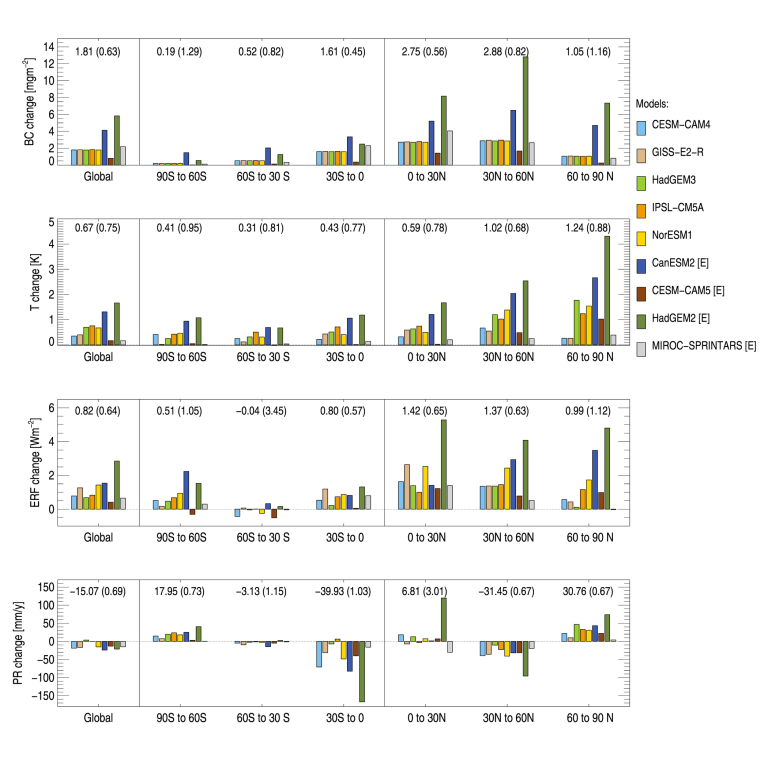
Figure 1 from PDRMIP article 3
First row: BCx10 minus BASE difference in BC load, second row: near-surface temperature, third row: ERF, and fourth row: precipitation. Changes are based on years 51–100 of the coupled runs, except for ERF which is based on the years 6–15 of the fSST runs. The leftmost groups of bars show the global mean responses, while the remaining groups are averages over the latitude bands indicated on the x axis. Numbers above the groups of bars show region averages (relative intermodel standard deviation in parentheses) for the given latitude band.
Rapid adjustments cause weak surface temperature response to increased black carbon concentrations
Camilla Weum Stjern,Bjørn Hallvard Samset, Gunnar Myhre, Piers M. Forster, Øivind Hodnebrog, Timothy Andrews, Olivier Boucher, Gregory Faluvegi, Trond Iversen, Matthew Kasoar, Viatcheslav Kharin, Alf Kirkevåg, Jean-François Lamarque, Dirk Olivié, Thomas Richardson, Dilshad Shawki, Drew Shindell, Christopher J. Smith, Toshihiko Takemura, Apostolos Voulgarakis
Journal of Geophysical Research: Atmospheres, 122. doi: 10.1002/2017JD027326
Figure 5 from PDRMIP article 3
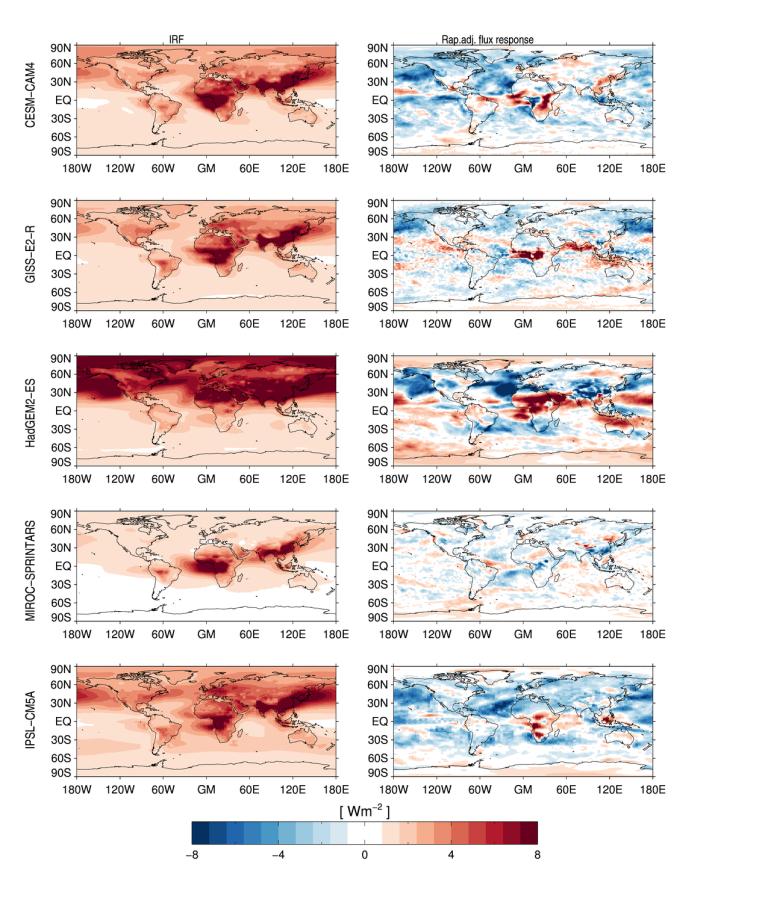
Left column: IRF and right column: rapid adjustment flux response, based on double call simulations for five of the models.
Rapid adjustments cause weak surface temperature response to increased black carbon concentrations
Camilla Weum Stjern,Bjørn Hallvard Samset, Gunnar Myhre, Piers M. Forster, Øivind Hodnebrog, Timothy Andrews, Olivier Boucher, Gregory Faluvegi, Trond Iversen, Matthew Kasoar, Viatcheslav Kharin, Alf Kirkevåg, Jean-François Lamarque, Dirk Olivié, Thomas Richardson, Dilshad Shawki, Drew Shindell, Christopher J. Smith, Toshihiko Takemura, Apostolos Voulgarakis
Journal of Geophysical Research: Atmospheres, 122. doi: 10.1002/2017JD027326
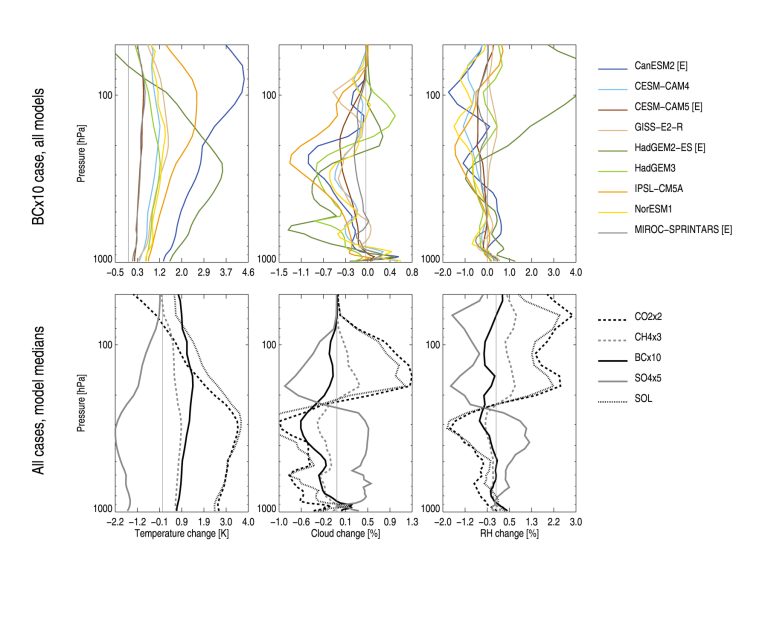
Figure 6 from PDRMIP article 3
Globally averaged vertical profiles of change in (left column) temperature, (middle column) cloud amount, and (right column) relative humidity. The top row shows the change for the BCx10 case, for each of the models, while the bottom row shows the model median change for each of the five cases. Note different x axis limits between top and bottom panels. Profiles are based on the last 50 years of the coupled runs.
Rapid adjustments cause weak surface temperature response to increased black carbon concentrations
Camilla Weum Stjern,Bjørn Hallvard Samset, Gunnar Myhre, Piers M. Forster, Øivind Hodnebrog, Timothy Andrews, Olivier Boucher, Gregory Faluvegi, Trond Iversen, Matthew Kasoar, Viatcheslav Kharin, Alf Kirkevåg, Jean-François Lamarque, Dirk Olivié, Thomas Richardson, Dilshad Shawki, Drew Shindell, Christopher J. Smith, Toshihiko Takemura, Apostolos Voulgarakis
Journal of Geophysical Research: Atmospheres, 122. doi: 10.1002/2017JD027326